Protection des Points de Terminaison
La section Protection des Points de Terminaison dans Boost Security offre une visibilité et un contrôle centralisés sur tous les composants logiciels installés sur les points de terminaison des développeurs — extensions de navigateur, plugins IDE, agents CLI, serveurs MCP et packages. Elle est particulièrement utile pour identifier les outils fantômes, extensions non approuvées et expositions de sécurité introduites au niveau de la station de travail du développeur.
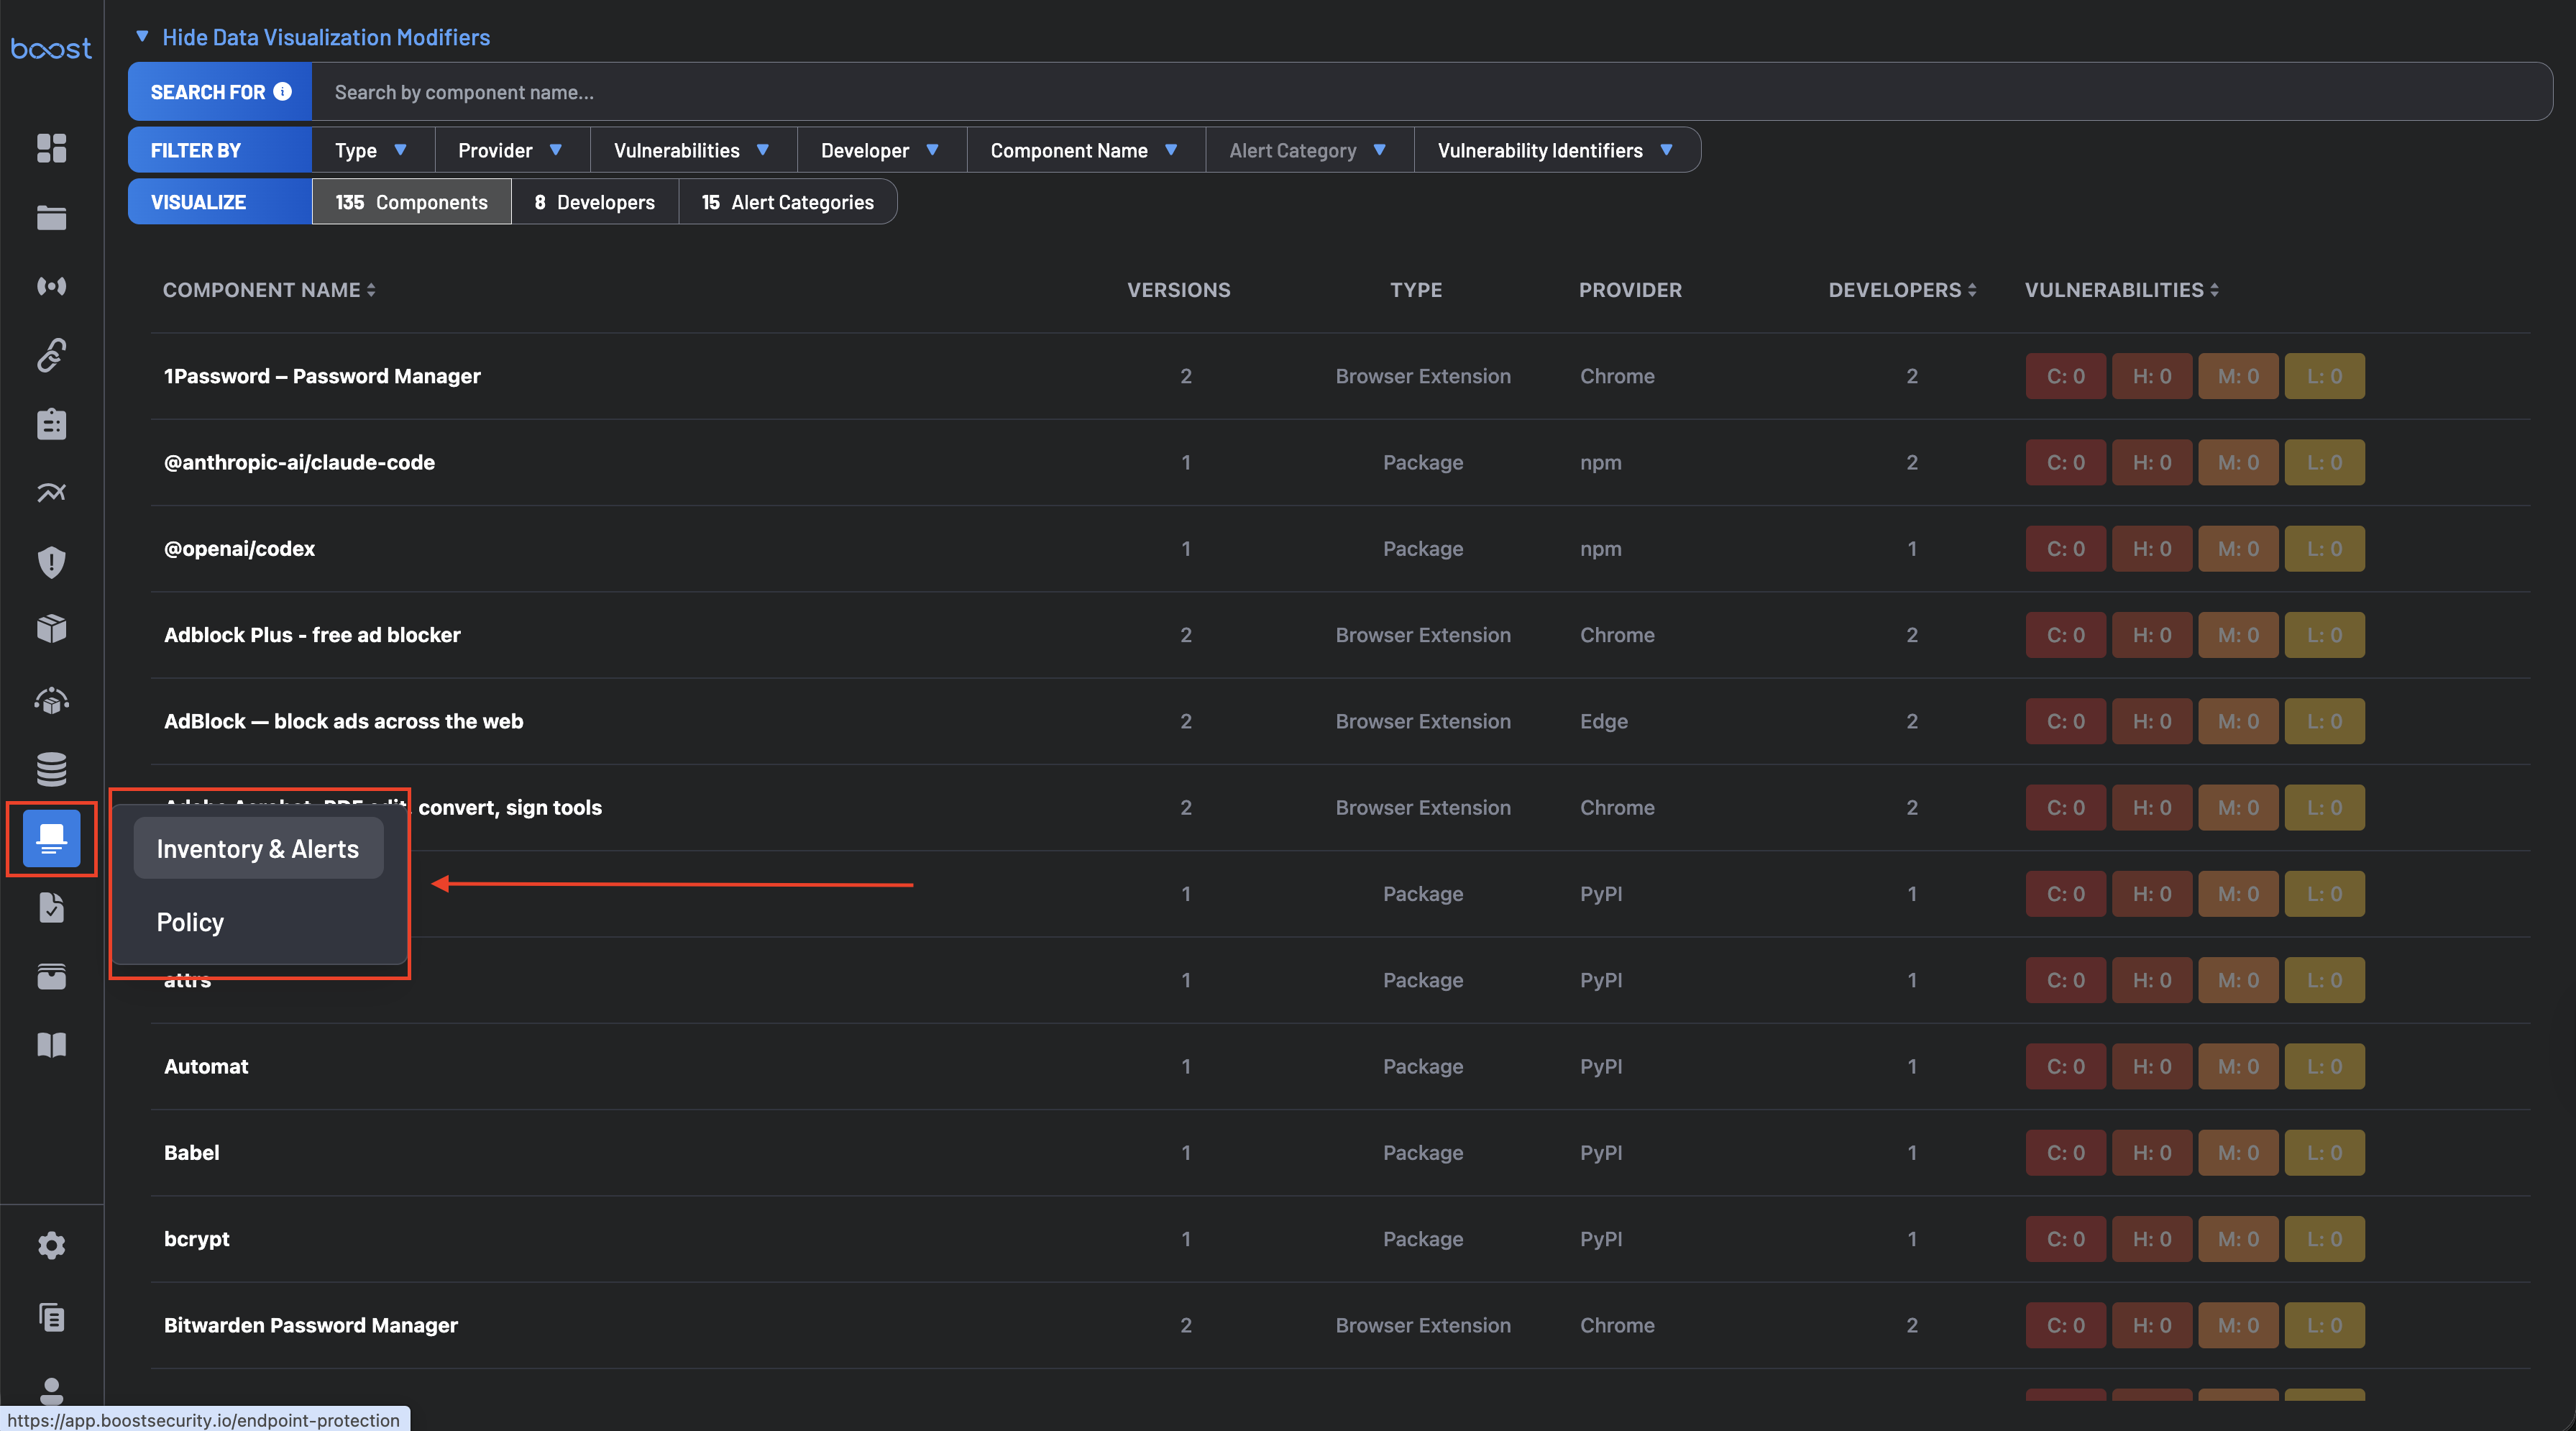
La Protection des Points de Terminaison se compose de deux pages, accessibles depuis le panneau de navigation :
- Inventaire & Alertes – Parcourez, filtrez et analysez les composants de point de terminaison détectés.
- Politique – Configurez les actions de réponse aux logiciels malveillants et les règles d'autorisation/refus des composants.
Installation
La Protection des Points de Terminaison peut être installée sur les points de terminaison de deux manières :
- Extension VS Code – Installez l'extension Boost Security IDE depuis le Marketplace de Visual Studio. Cela permet une visibilité des points de terminaison directement depuis VS Code et installe également le serveur MCP de Boost pour un codage agentique plus sécurisé.
- Script – Installez la Protection des Points de Terminaison avec un script, idéal pour les points de terminaison qui n'utilisent pas VS Code ou pour un déploiement large à travers plusieurs points de terminaison via des outils EDR.
Inventaire et Alertes
L'interface principale pour explorer les données des composants d'endpoint dans votre organisation.
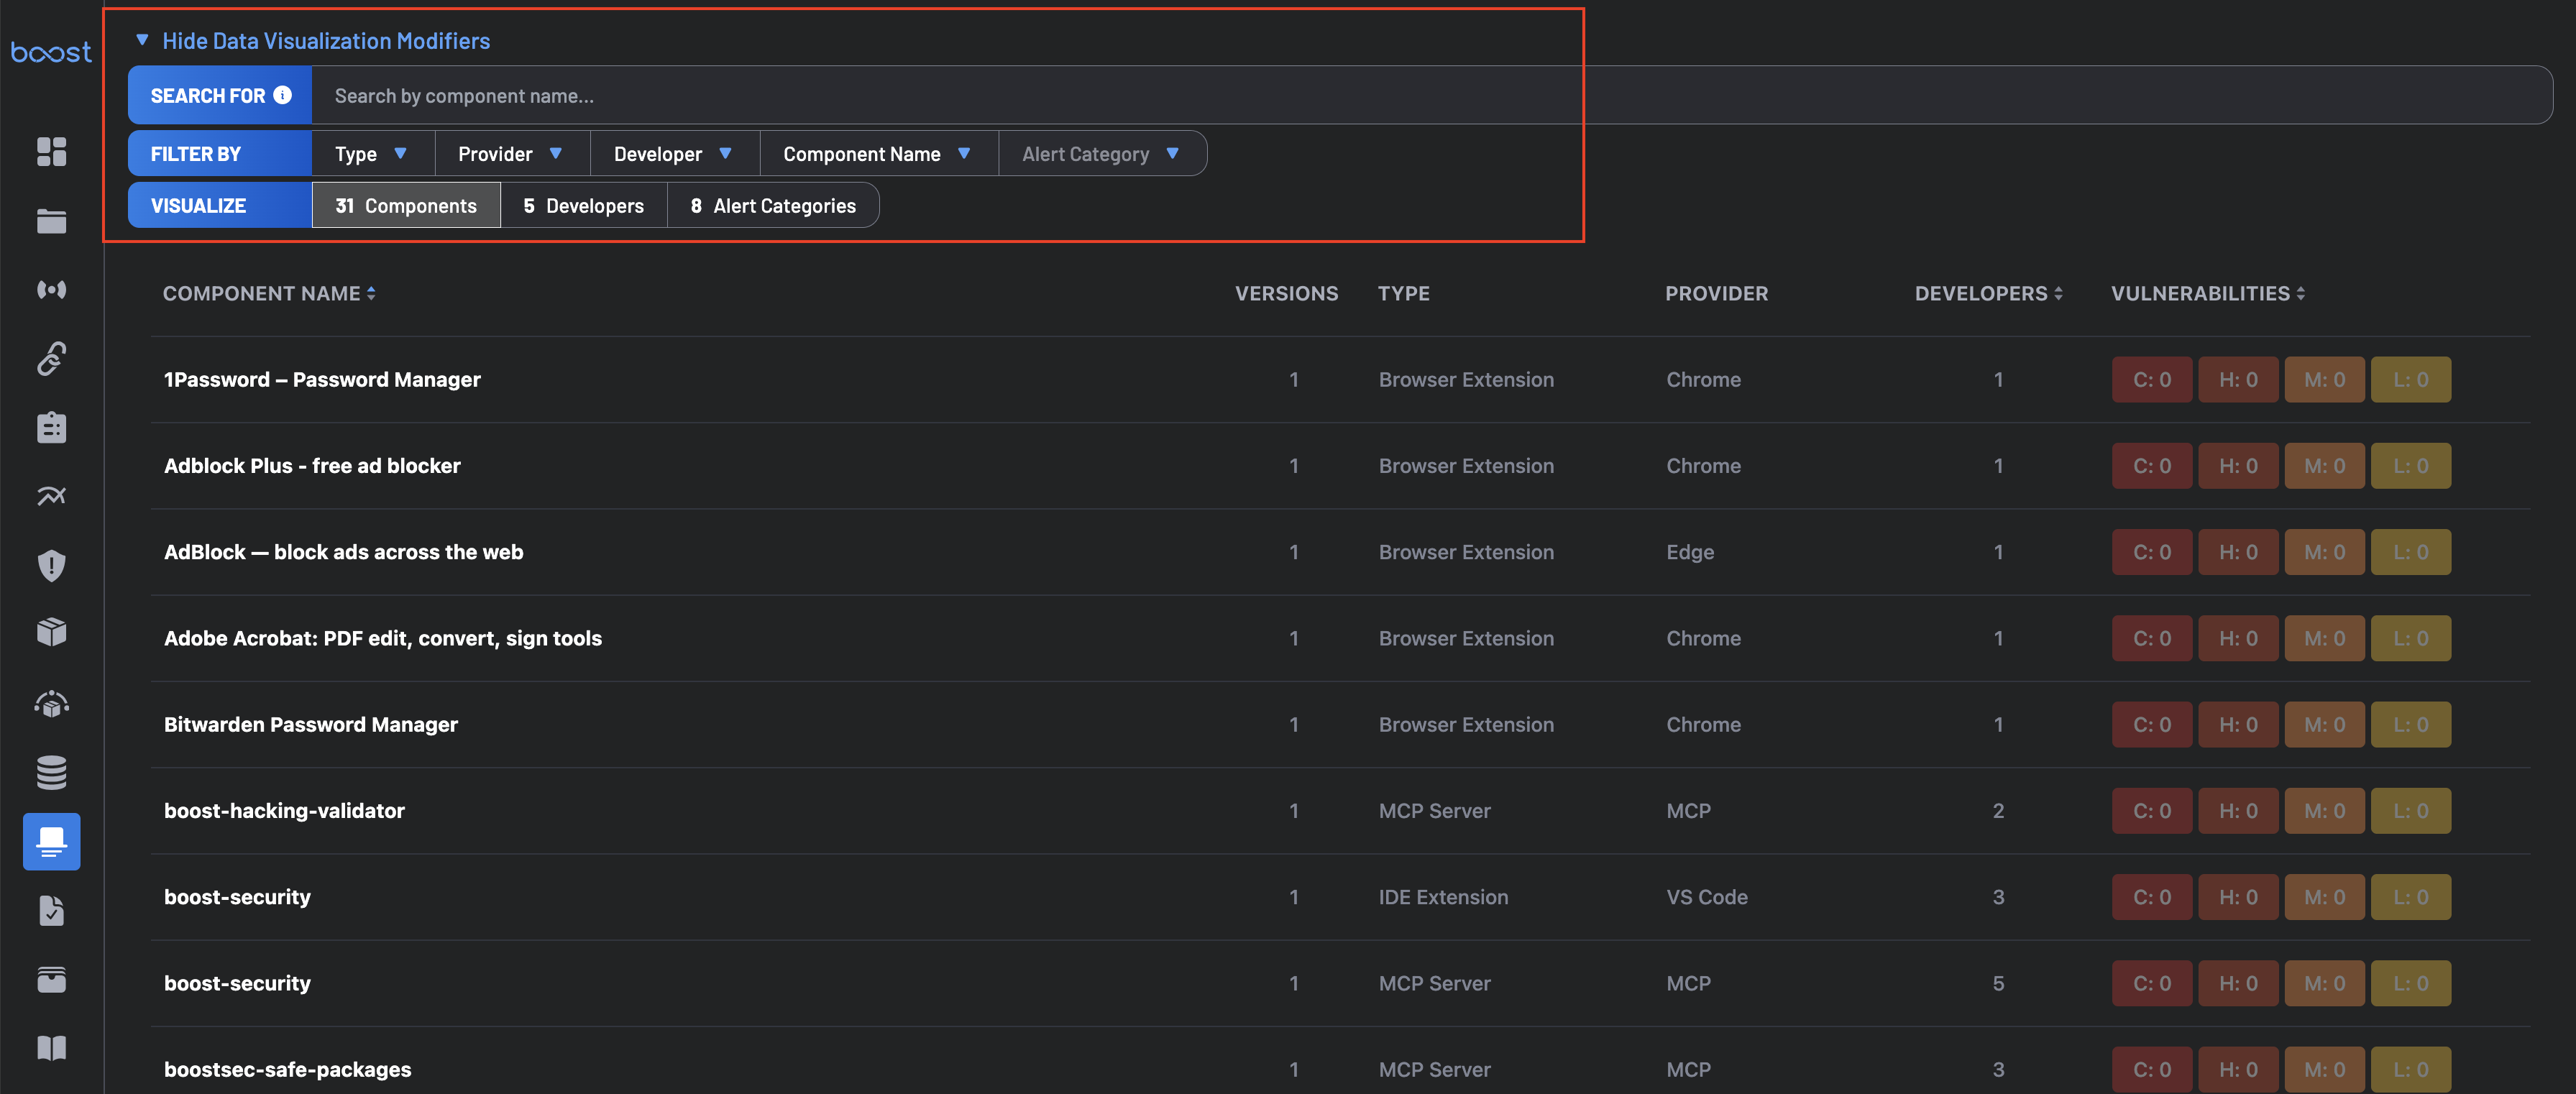
Panneau de Filtres
-
Rechercher – Rechercher des composants par nom en utilisant la barre de recherche.
-
Filtrer Par – Prend en charge la sélection multiple à travers : Type, Fournisseur, Vulnérabilités, Développeur, Nom du Composant, Catégorie d'Alerte et Identifiants de Vulnérabilité.
- Type : Extension de Navigateur, Extension IDE, Agent CLI, Serveur MCP, Package
- Fournisseur : Chrome, Edge, Firefox, Brave, VS Code, Cursor, Jetbrains, CLI, MCP, npm, PyPI, Brew, Compétence d'Agent, et plus
-
Visualiser – Trois métriques agrégées cliquables qui changent la vue principale du tableau :
- Composants – Total unique de composants détectés. Retourne au Tableau des Composants.
- Développeurs – Total des développeurs avec des composants détectés. Switch vers la vue Développeurs.
- Catégories d'Alerte – Total des catégories d'alerte distinctes déclenchées. Switch vers la vue Catégories d'Alerte.
Tableau des composants
Liste tout le logiciel de point de terminaison détecté. Les colonnes sont triables, les badges de vulnérabilité sont codés par couleur, et les lignes sont cliquables pour les détails.
- Nom du Composant – Tout logiciel de point de terminaison : extensions de navigateur, plugins IDE, agents CLI, serveurs MCP, ou paquets.
- Versions – Version(s) installée(s) du composant.
- Type – Extension de navigateur, Extension IDE, Agent CLI, Serveur MCP, ou Paquet.
- Fournisseur – Plateforme ou écosystème d'origine, par exemple, Chrome, VS Code, MCP, npm.
- Développeurs – Nombre d'utilisateurs ayant le composant installé.
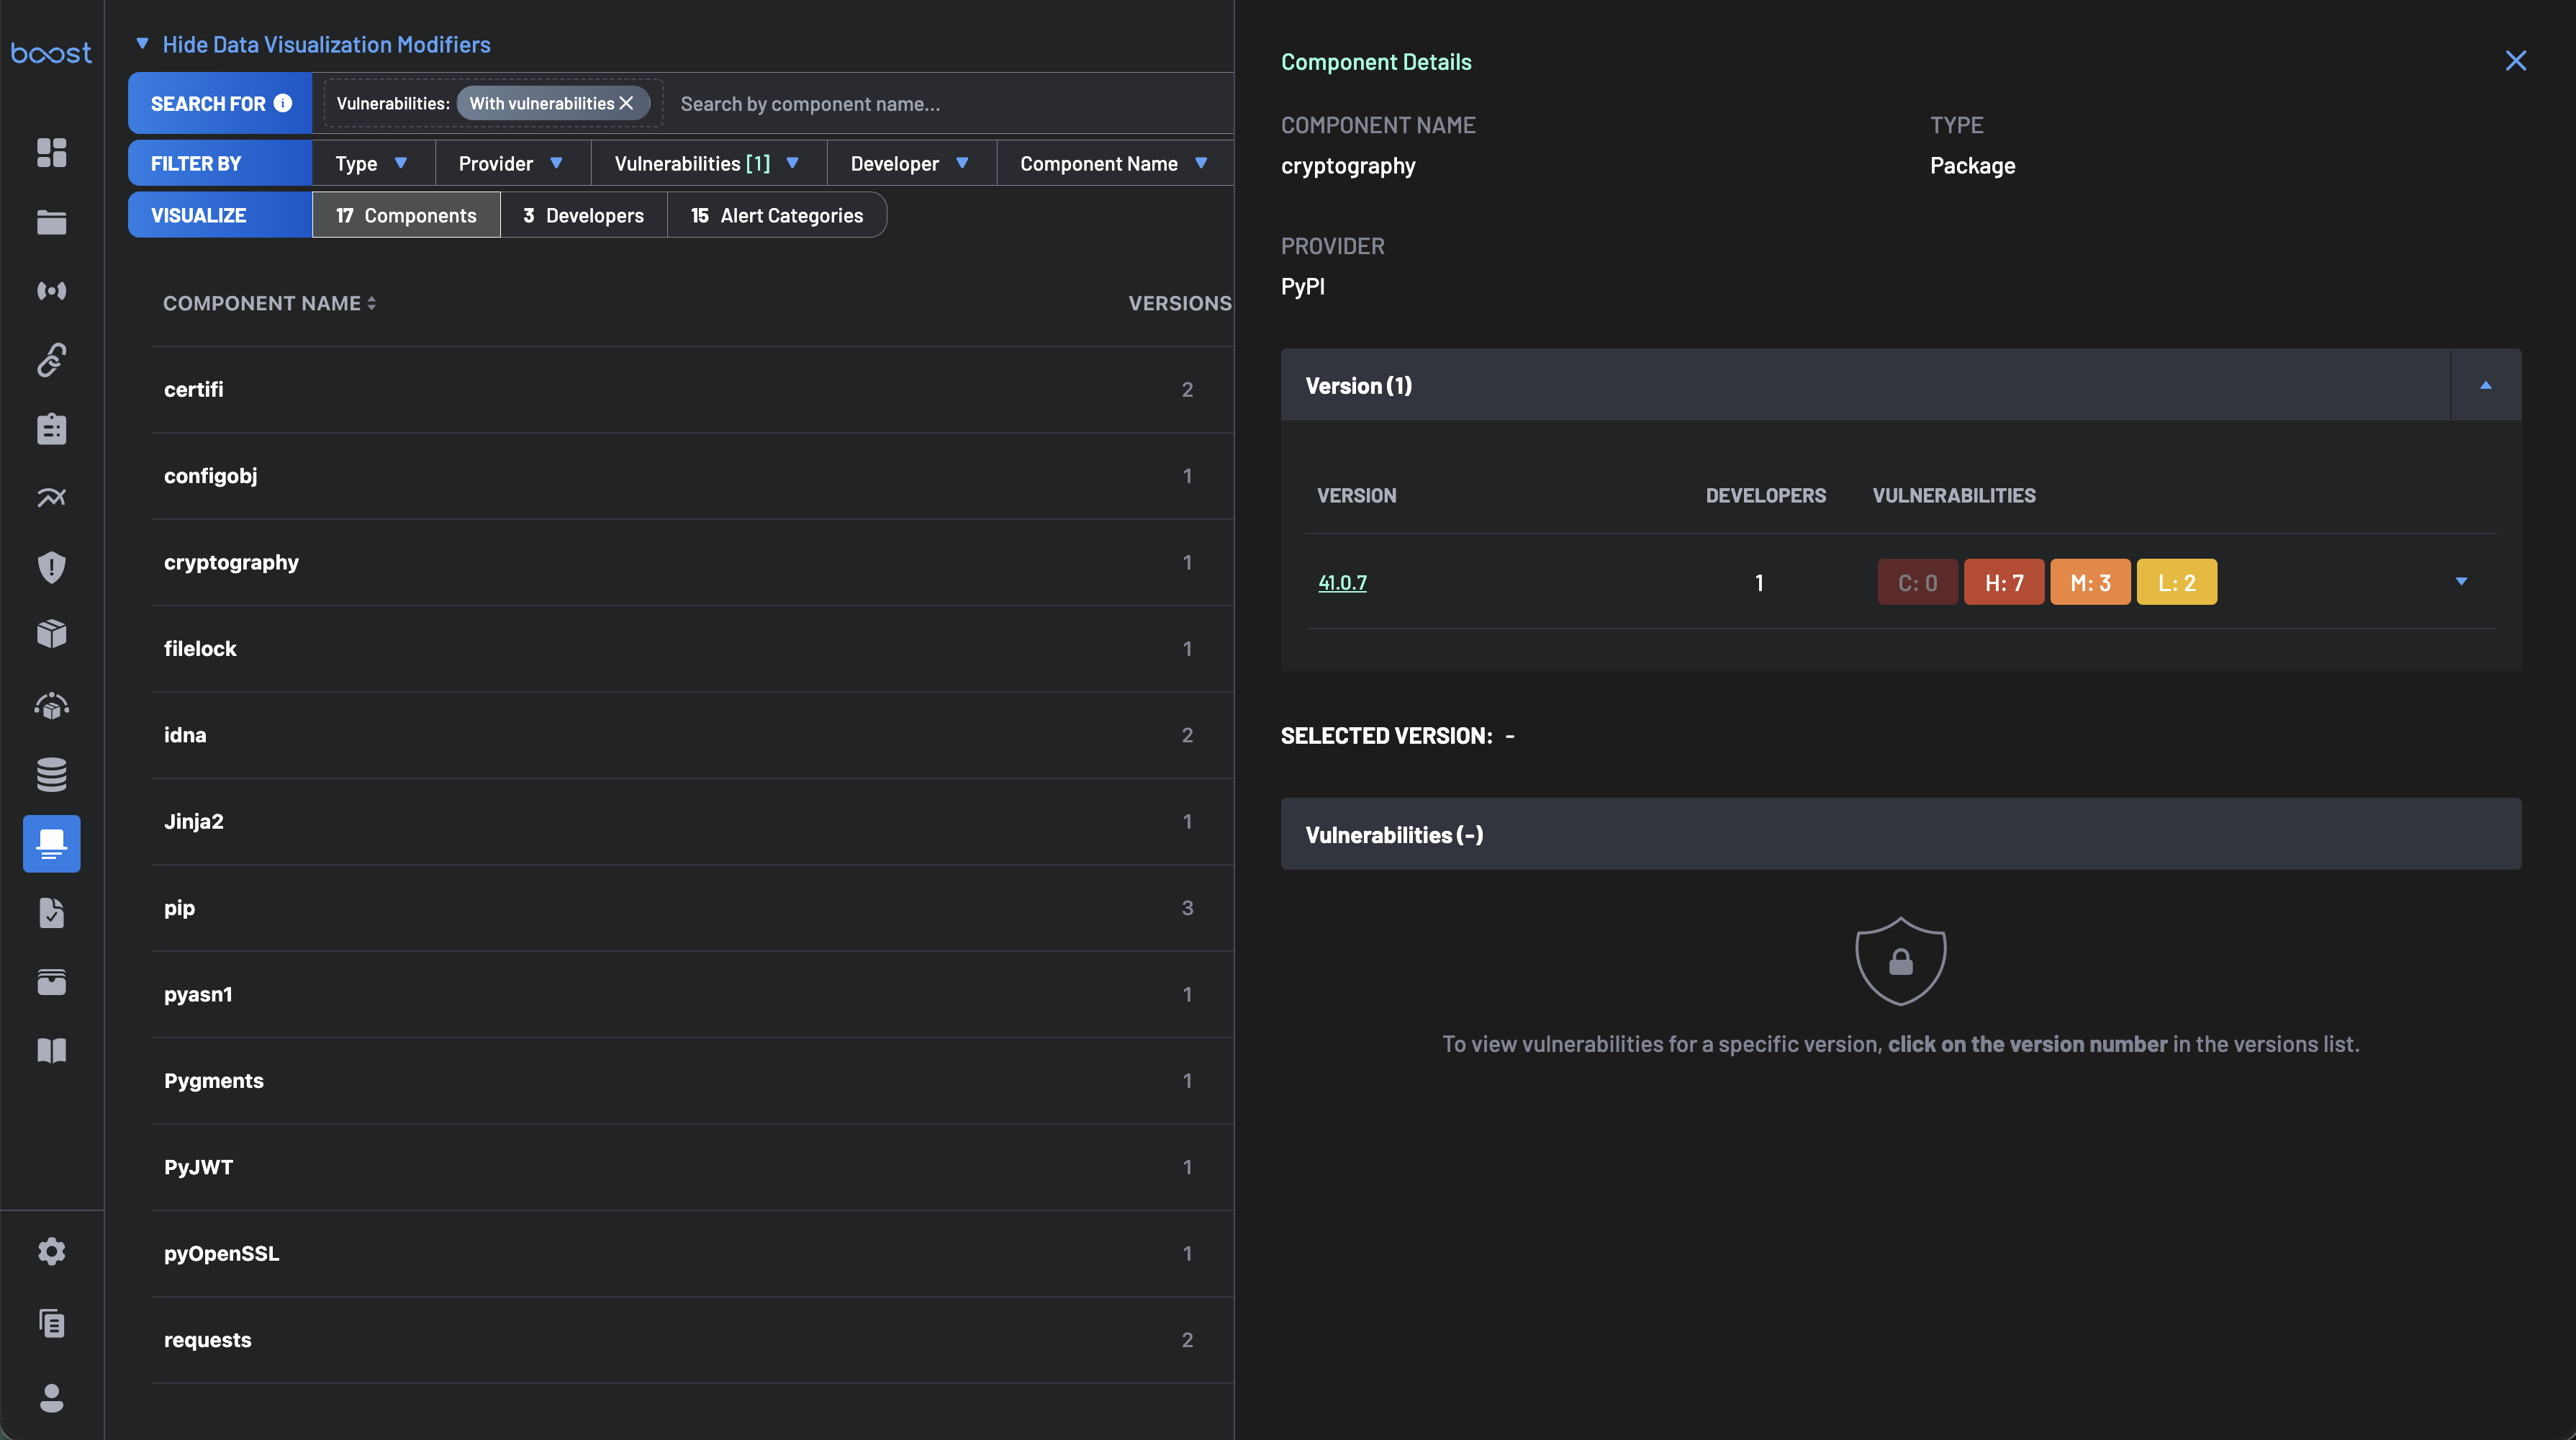
- Vulnérabilités – CVEs connus par gravité : C - Critique · H - Élevé · M - Moyen · L - Faible
Cliquer sur une ligne ouvre un panneau Détails du Composant affichant le nom du composant, le type, le fournisseur, et une répartition par version du nombre de développeurs et des vulnérabilités associées par version — utile pour identifier les installations obsolètes et prioriser la remédiation.
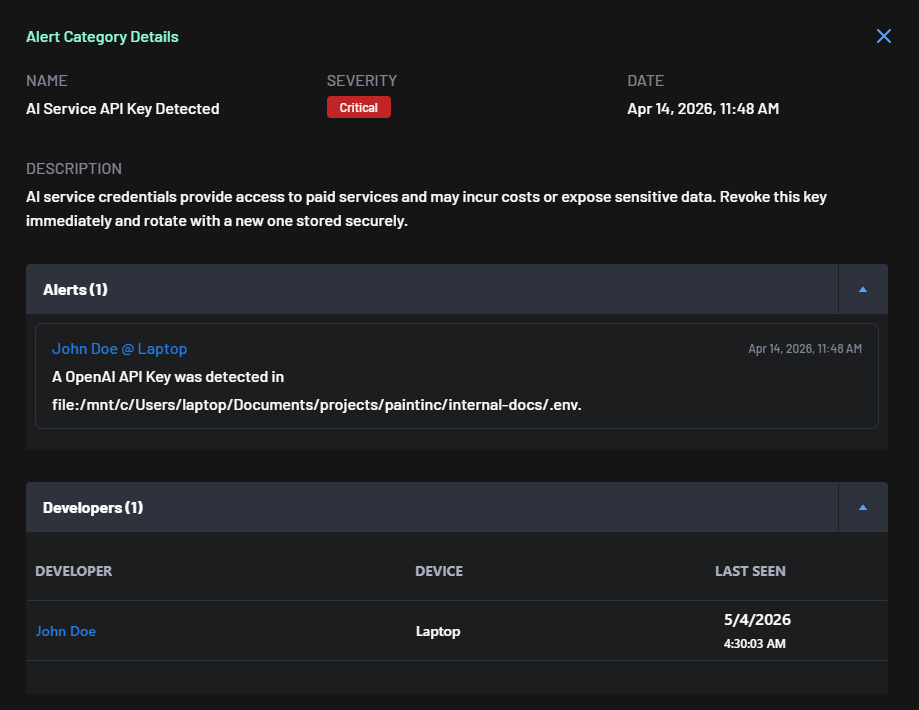
Vue des Catégories d'Alerte
En cliquant sur Catégories d'Alerte dans la barre Visualiser, le tableau passe à une vue centrée sur les alertes de sécurité. La barre de recherche se met à jour pour afficher Rechercher par nom de catégorie d'alerte....
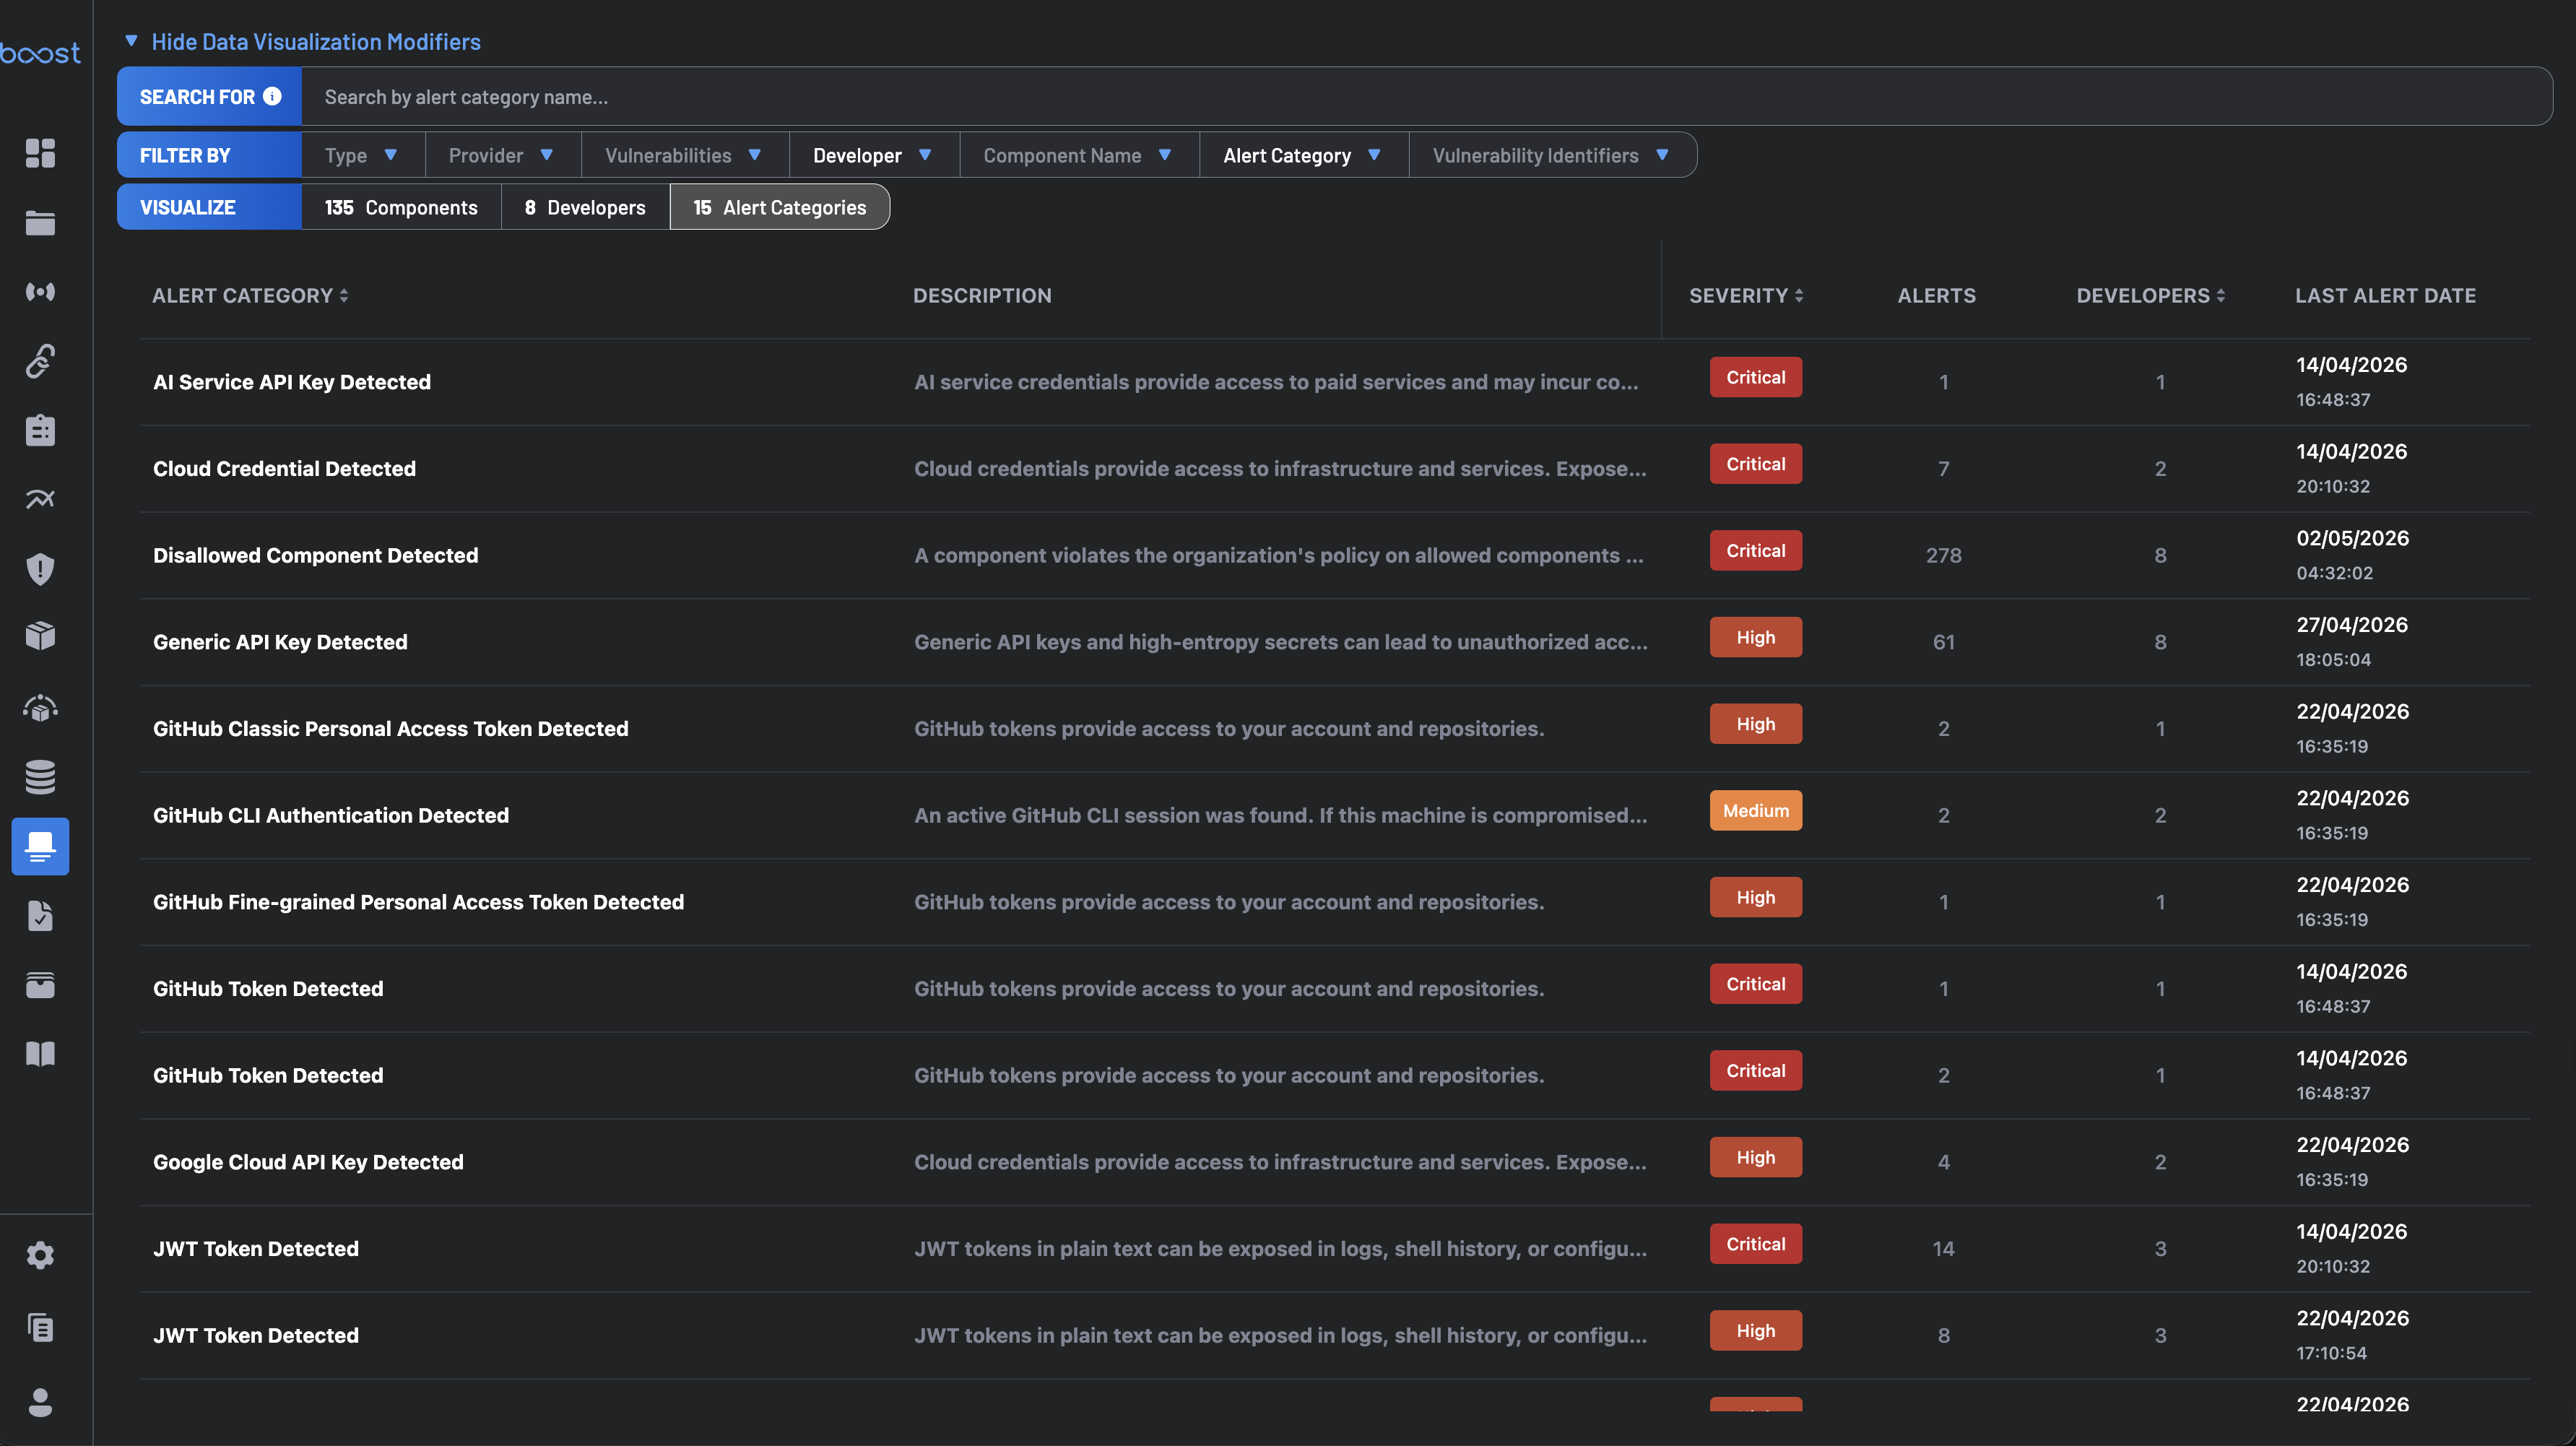
Chaque ligne couvre une catégorie d'alerte distincte avec des colonnes pour Catégorie d'Alerte, Description, Gravité, le nombre d'Alertes, le nombre de Développeurs, et la Date de la Dernière Alerte. Les lignes sont triables.
Cliquez sur une ligne pour ouvrir un panneau Détails de la Catégorie d'Alerte avec la description des risques complète et les conseils de remédiation, une liste d'Alertes (développeur @ appareil, horodatage, et chemin exact du fichier où le problème a été trouvé), et une liste de Développeurs (développeur, appareil, horodatage de la dernière apparition — chaque nom de développeur est cliquable pour ouvrir Détails du Développeur).
Vue des développeurs
Cliquer sur Développeurs dans la barre Visualiser change le tableau en une vue de risque centrée sur les développeurs. La barre de recherche se met à jour avec Rechercher par nom de développeur....
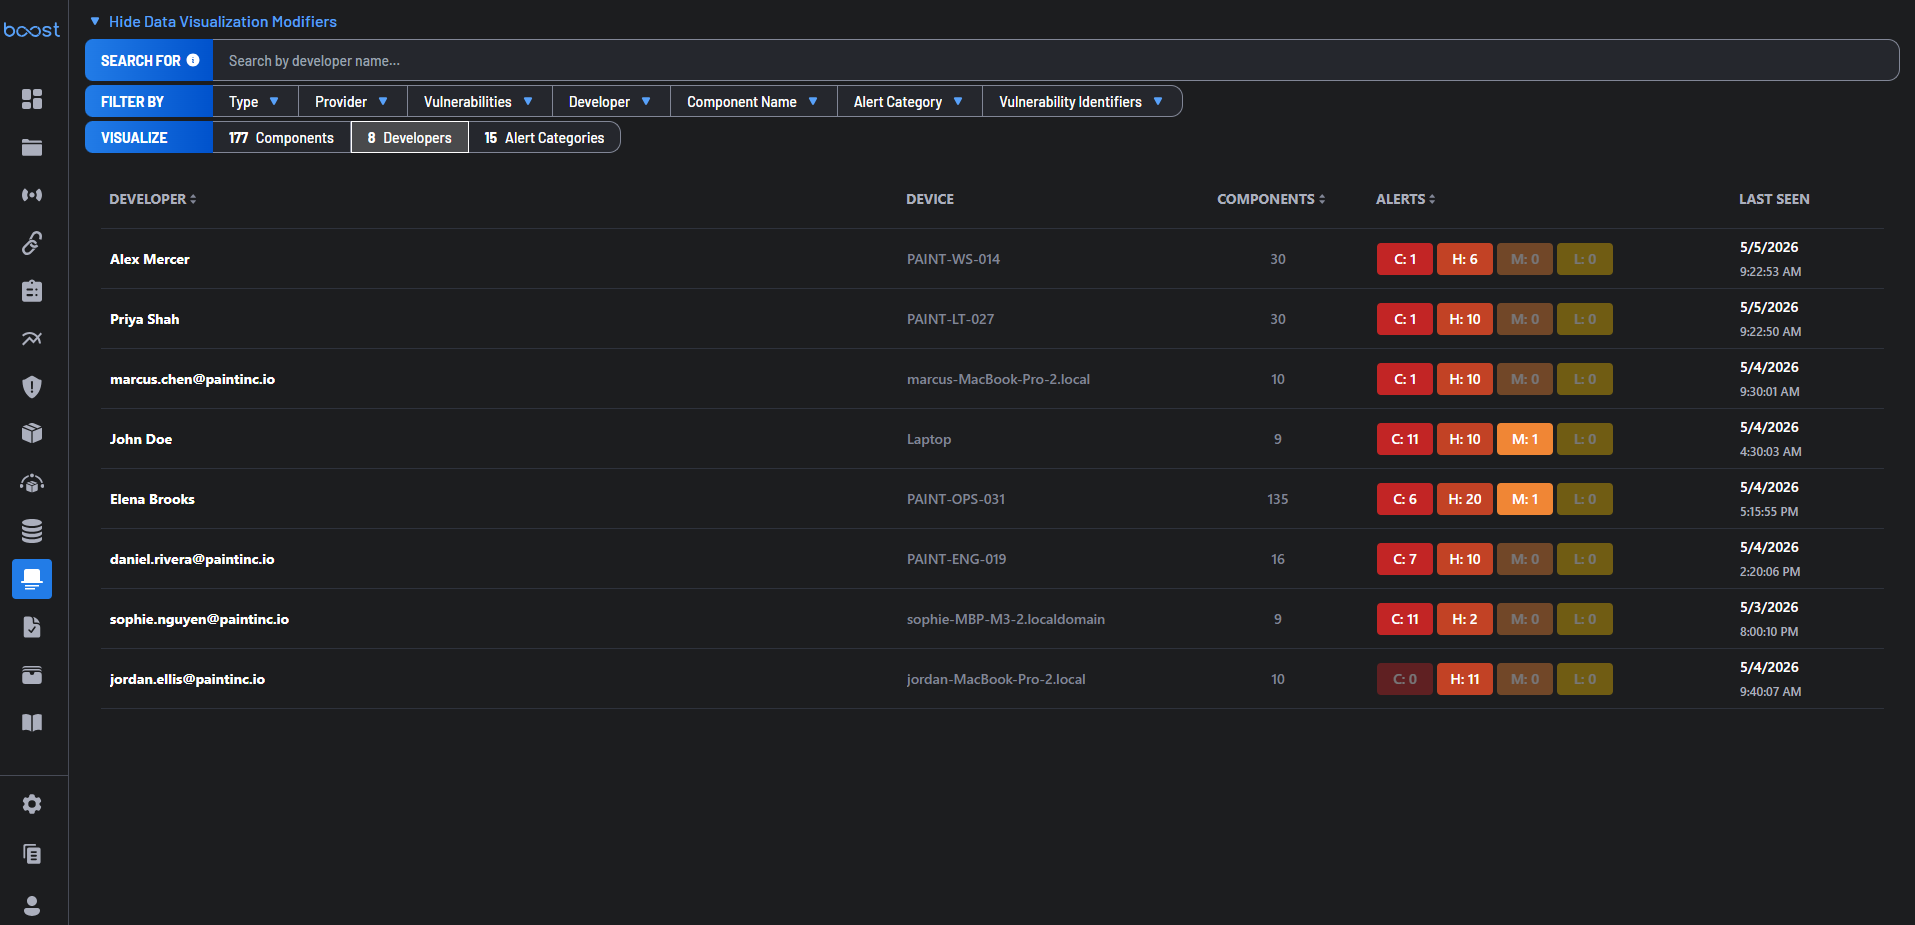
Chaque ligne montre Développeur, Appareil, le nombre de Composants, Alertes par sévérité (C/H/M/L), et la Dernière vue. Un développeur peut apparaître plusieurs fois s'il a été observé sur plusieurs appareils.
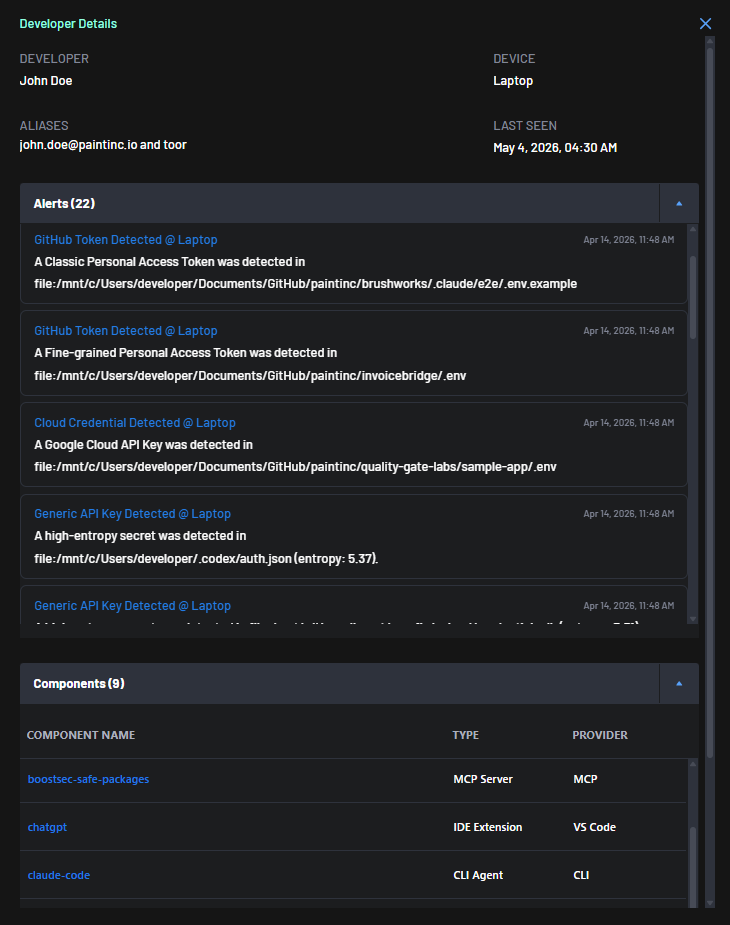
Cliquer sur une ligne ouvre un panneau Détails du Développeur avec :
- En-tête – Nom du développeur, appareil, alias (adresses e-mail ou noms d'utilisateur système), et horodatage de la dernière vue.
- Alertes – Chaque alerte sur les points de terminaison de ce développeur : type d'alerte, appareil, horodatage, chemin de fichier, et détail technique (par exemple, scores d'entropie pour les secrets détectés).
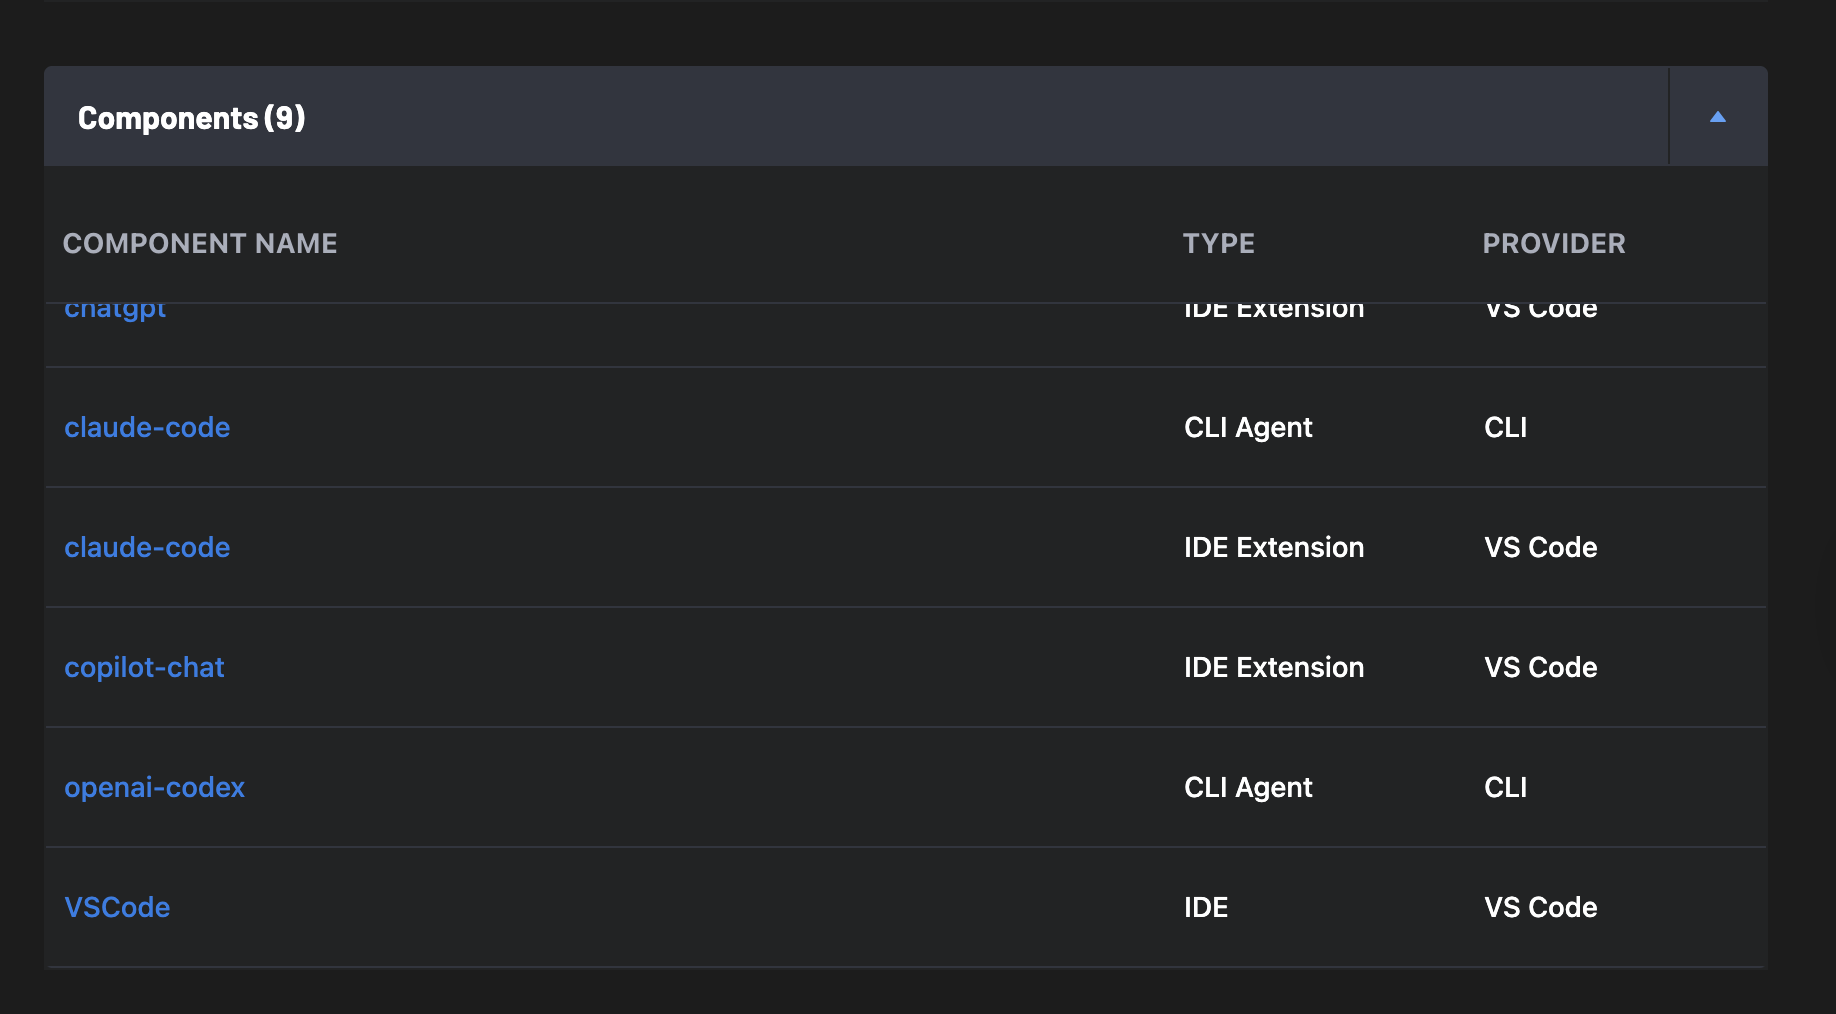
- Composants – Tous les logiciels de point de terminaison détectés pour ce développeur, montrant le nom du composant, le type, et le fournisseur.
Flux de travail communs
1. Identifier les composants à haut risque
- Naviguez vers Protection des points d'extrémité > Inventaire & Alertes
- Triez par vulnérabilités Critiques (C) ou Élevées (H)
- Cliquez sur un composant pour examiner les détails de version et les développeurs concernés
2. Enquêter sur l'exposition des développeurs
- Cliquez sur Développeurs dans la barre Visualiser
- Triez par alertes Critiques pour faire ressortir les développeurs les plus à risque
- Cliquez sur un développeur pour examiner son historique complet d'alertes et les composants installés
3. Détecter les outils non approuvés
- Filtrez par Fournisseur ou Type pour réduire le champ d’application
- Scannez à la recherche d'outils inconnus ou non autorisés
- Configurez une Politique de Protection des Points d'Extrémité pour faire respecter la gouvernance
Meilleures pratiques
- Révisez régulièrement les composants avec des vulnérabilités Critiques et Élevées
- Standardisez les outils approuvés entre les équipes
- Surveillez les nouveaux composants introduits pour évaluer les risques
- Utilisez des filtres pour segmenter l'analyse par équipe ou fournisseur
- Configurez une Politique de Protection des Points de Terminaison pour automatiser l'application et la réponse aux logiciels malveillants