Explore the Dashboard
The Boost Security dashboard provides a high-level overview of security findings, policy violations, developer activities, and other crucial metrics. This page is designed to give users quick insights into the security posture of their repositories.
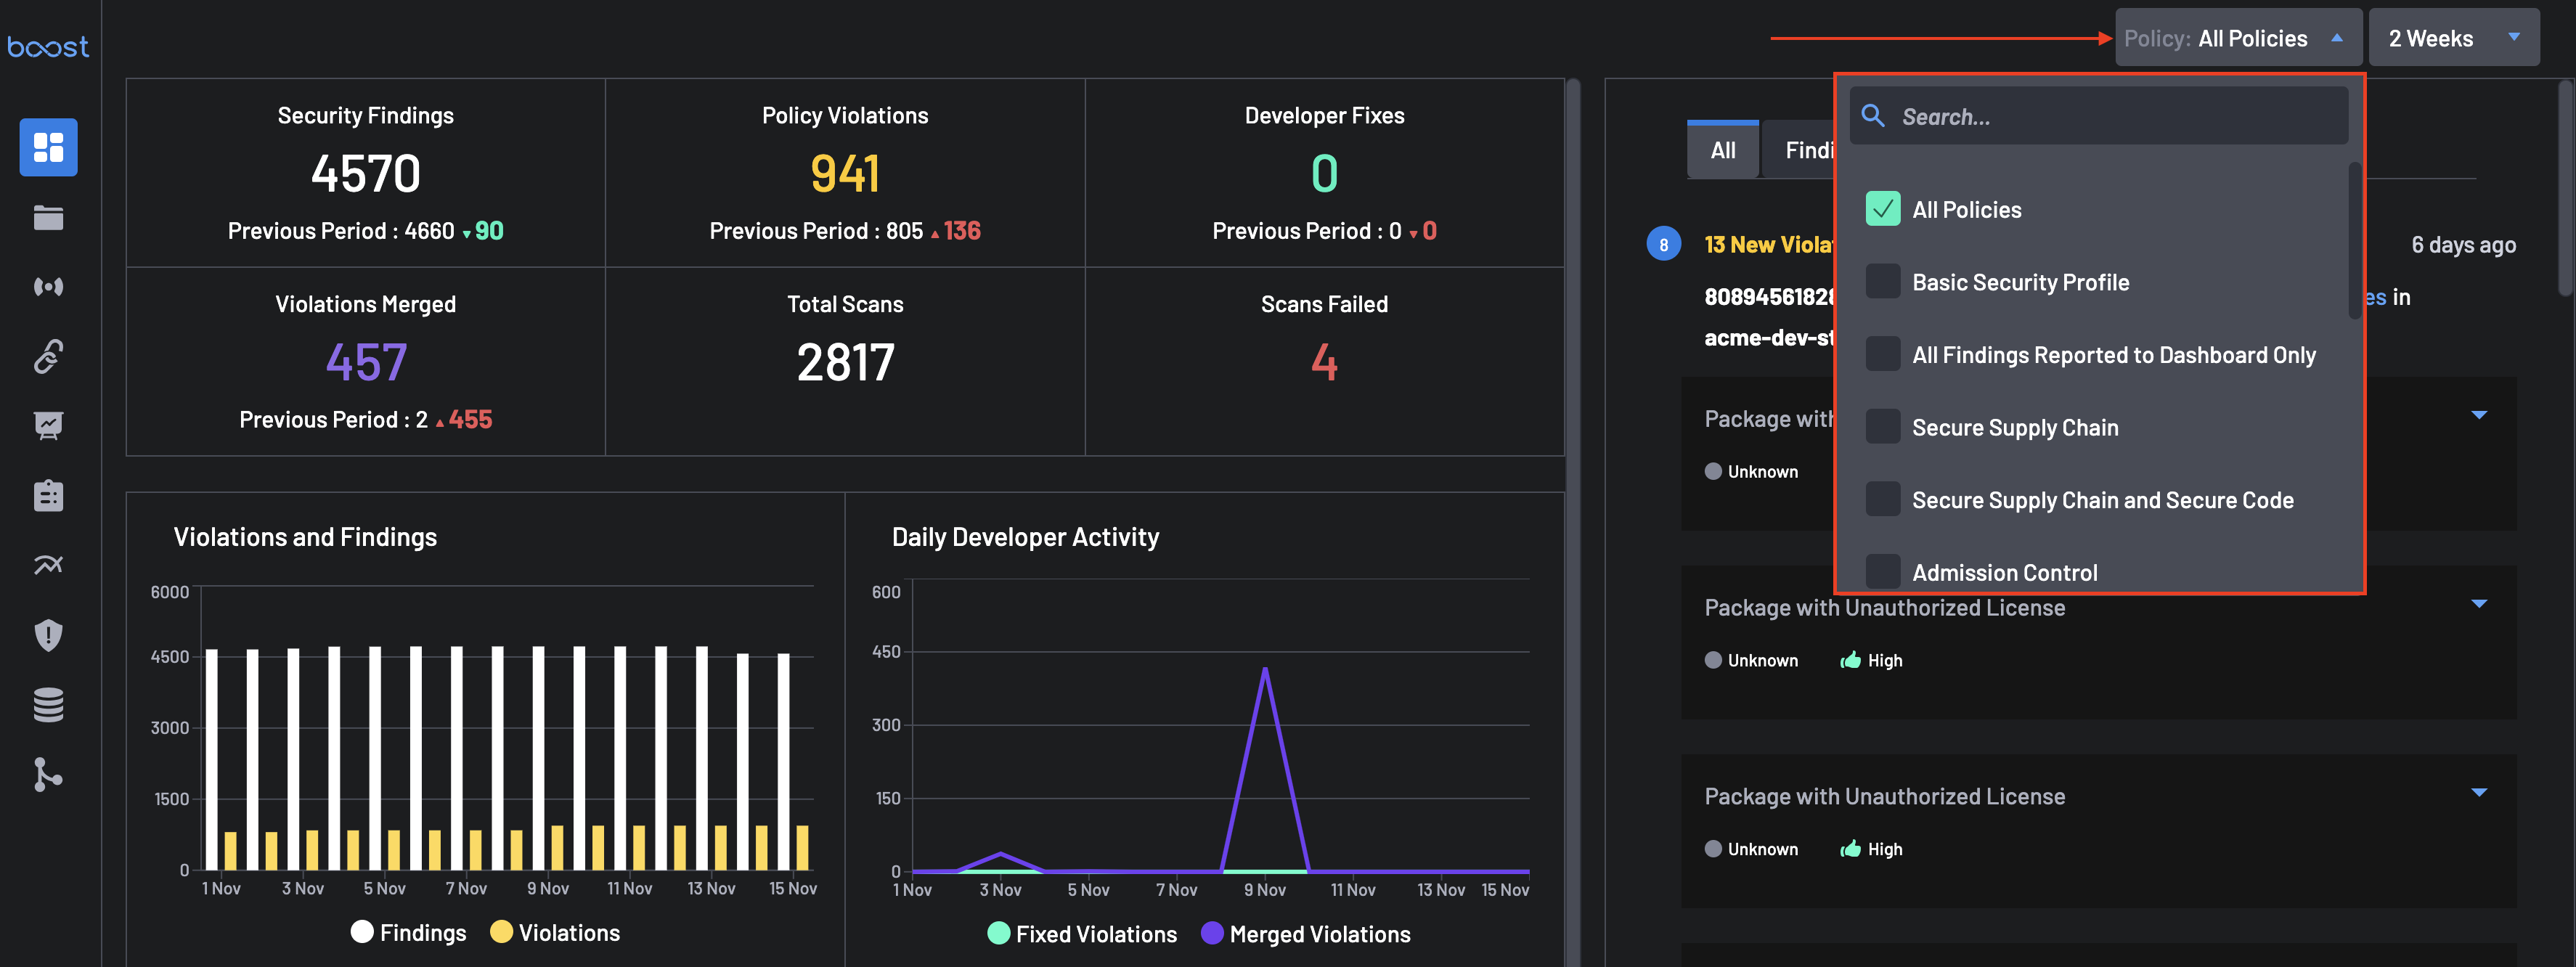
Page Filtering
The dashboard provides options that are filterable which include:
-
Policy Filter: Located at the top-left in the filter by section, allowing users to filter the displayed data by specific policies or a selection of all the policies by clicking the Select All checkbox.
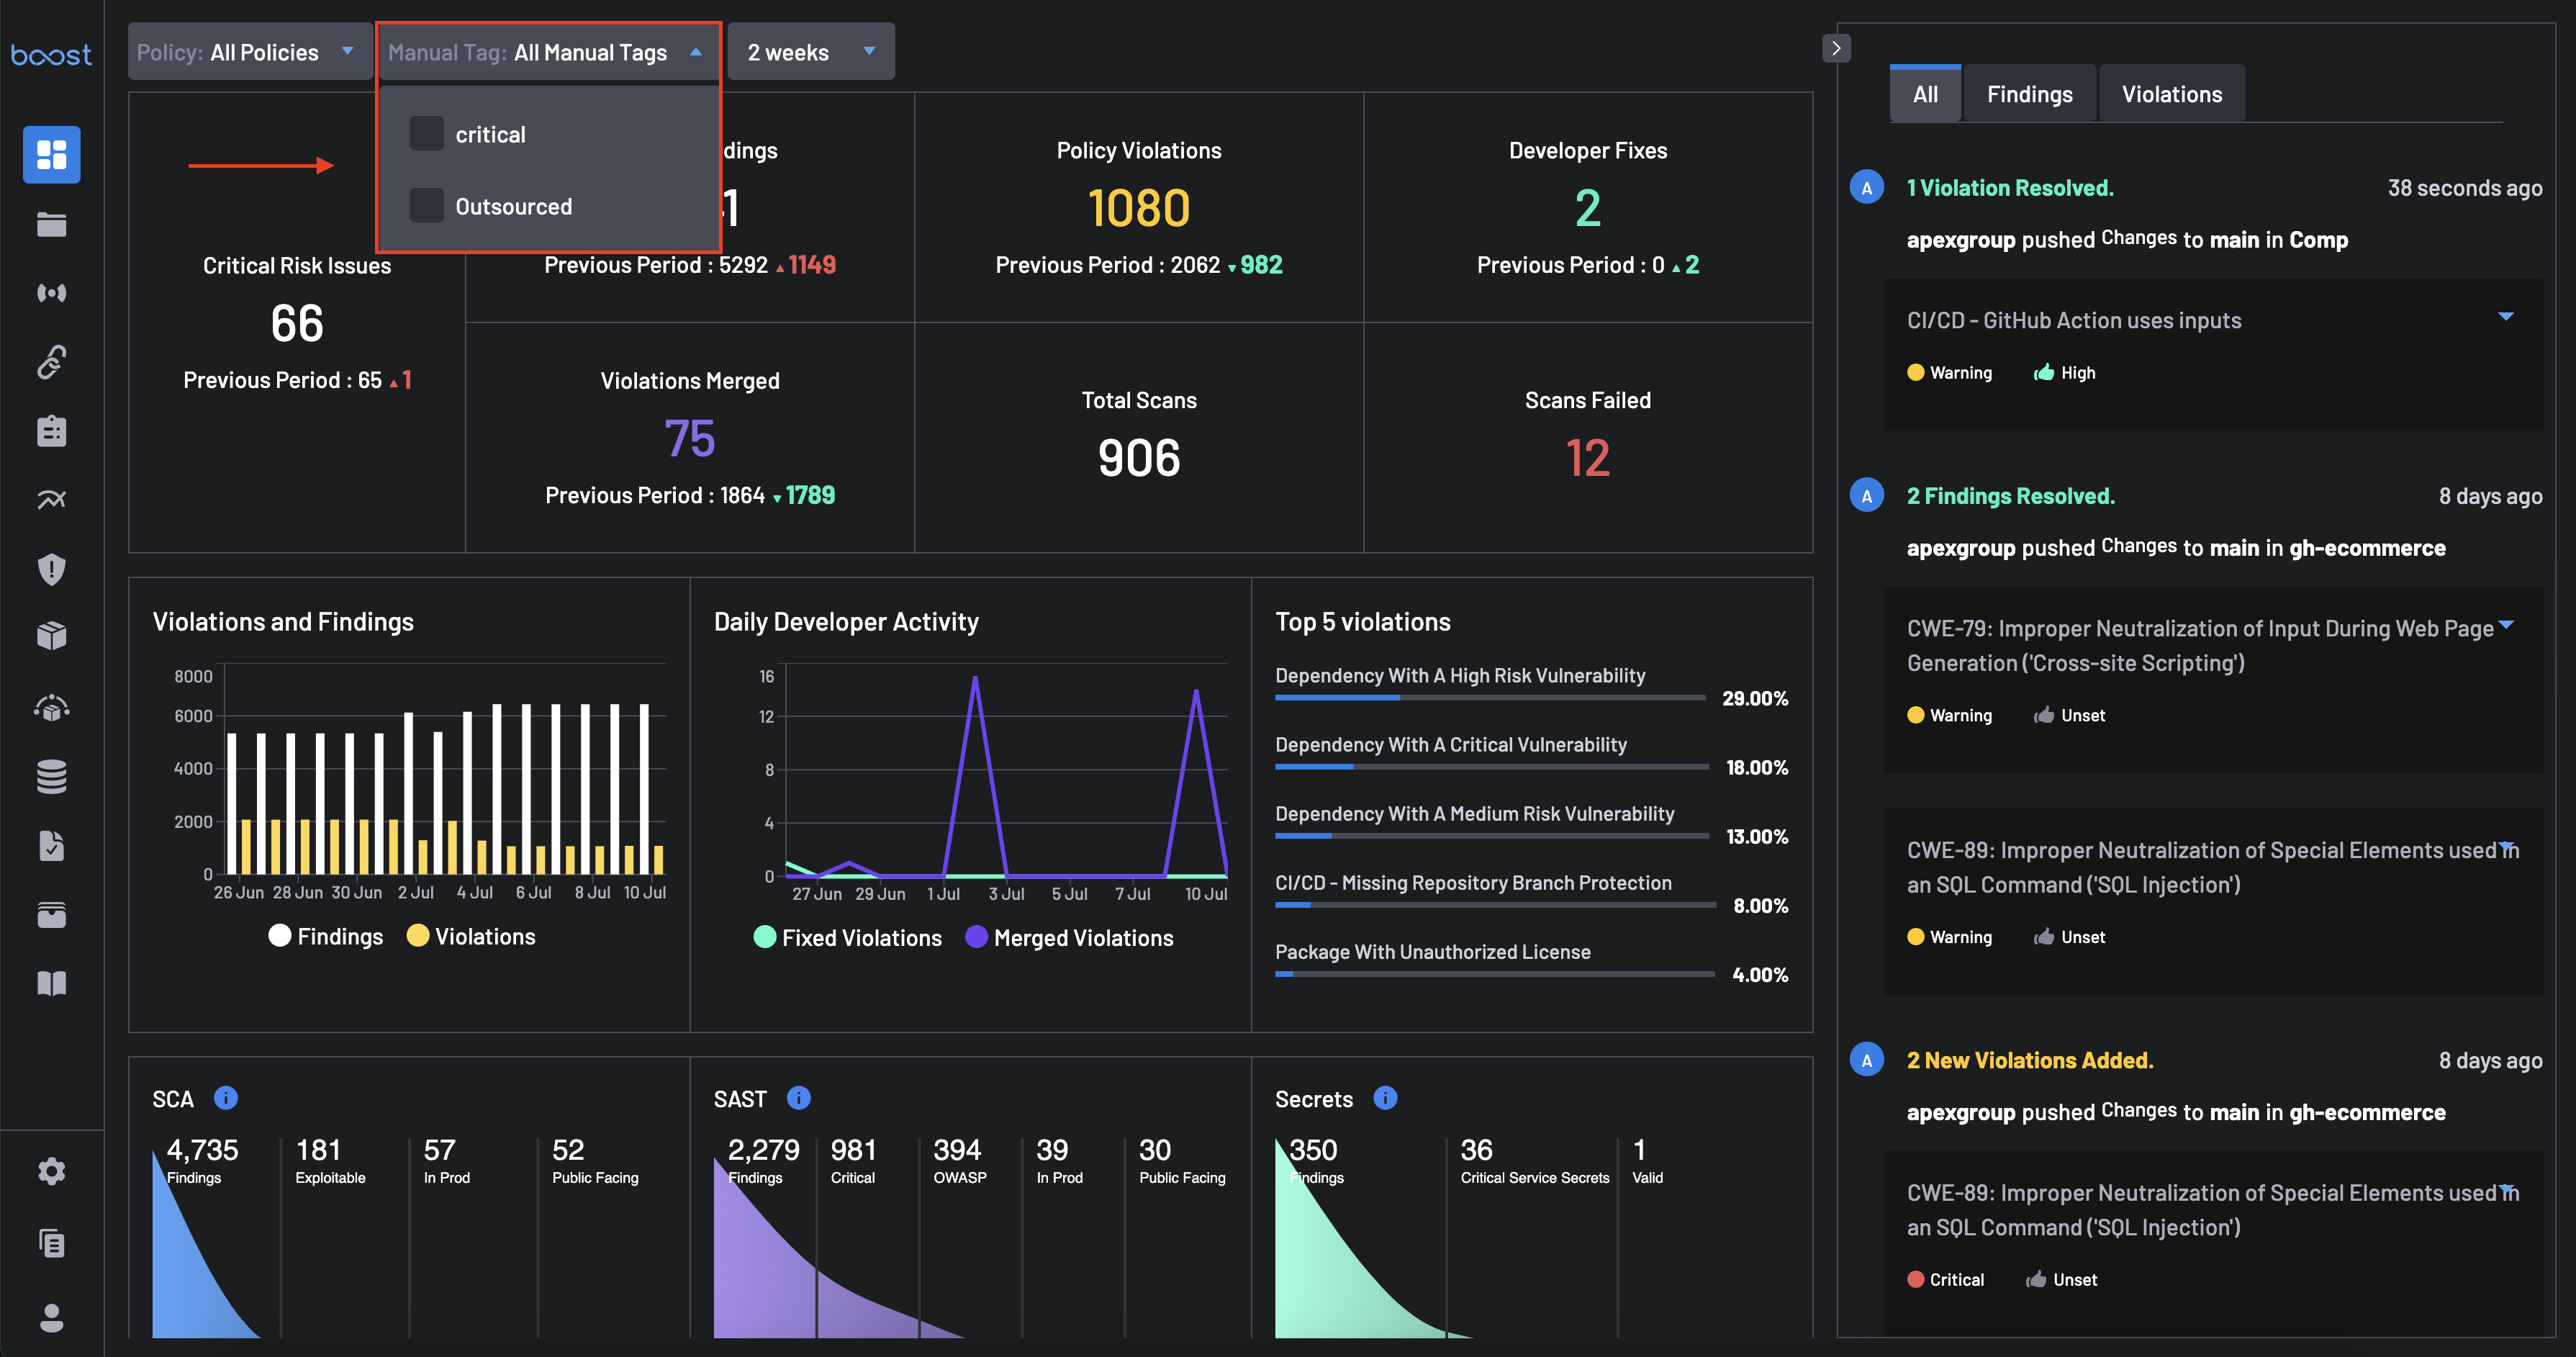
-
Filter By Manual Tags - Located next to the policy filter, this allows users filter results on the dashboard by specific or all manual tags created on the system.
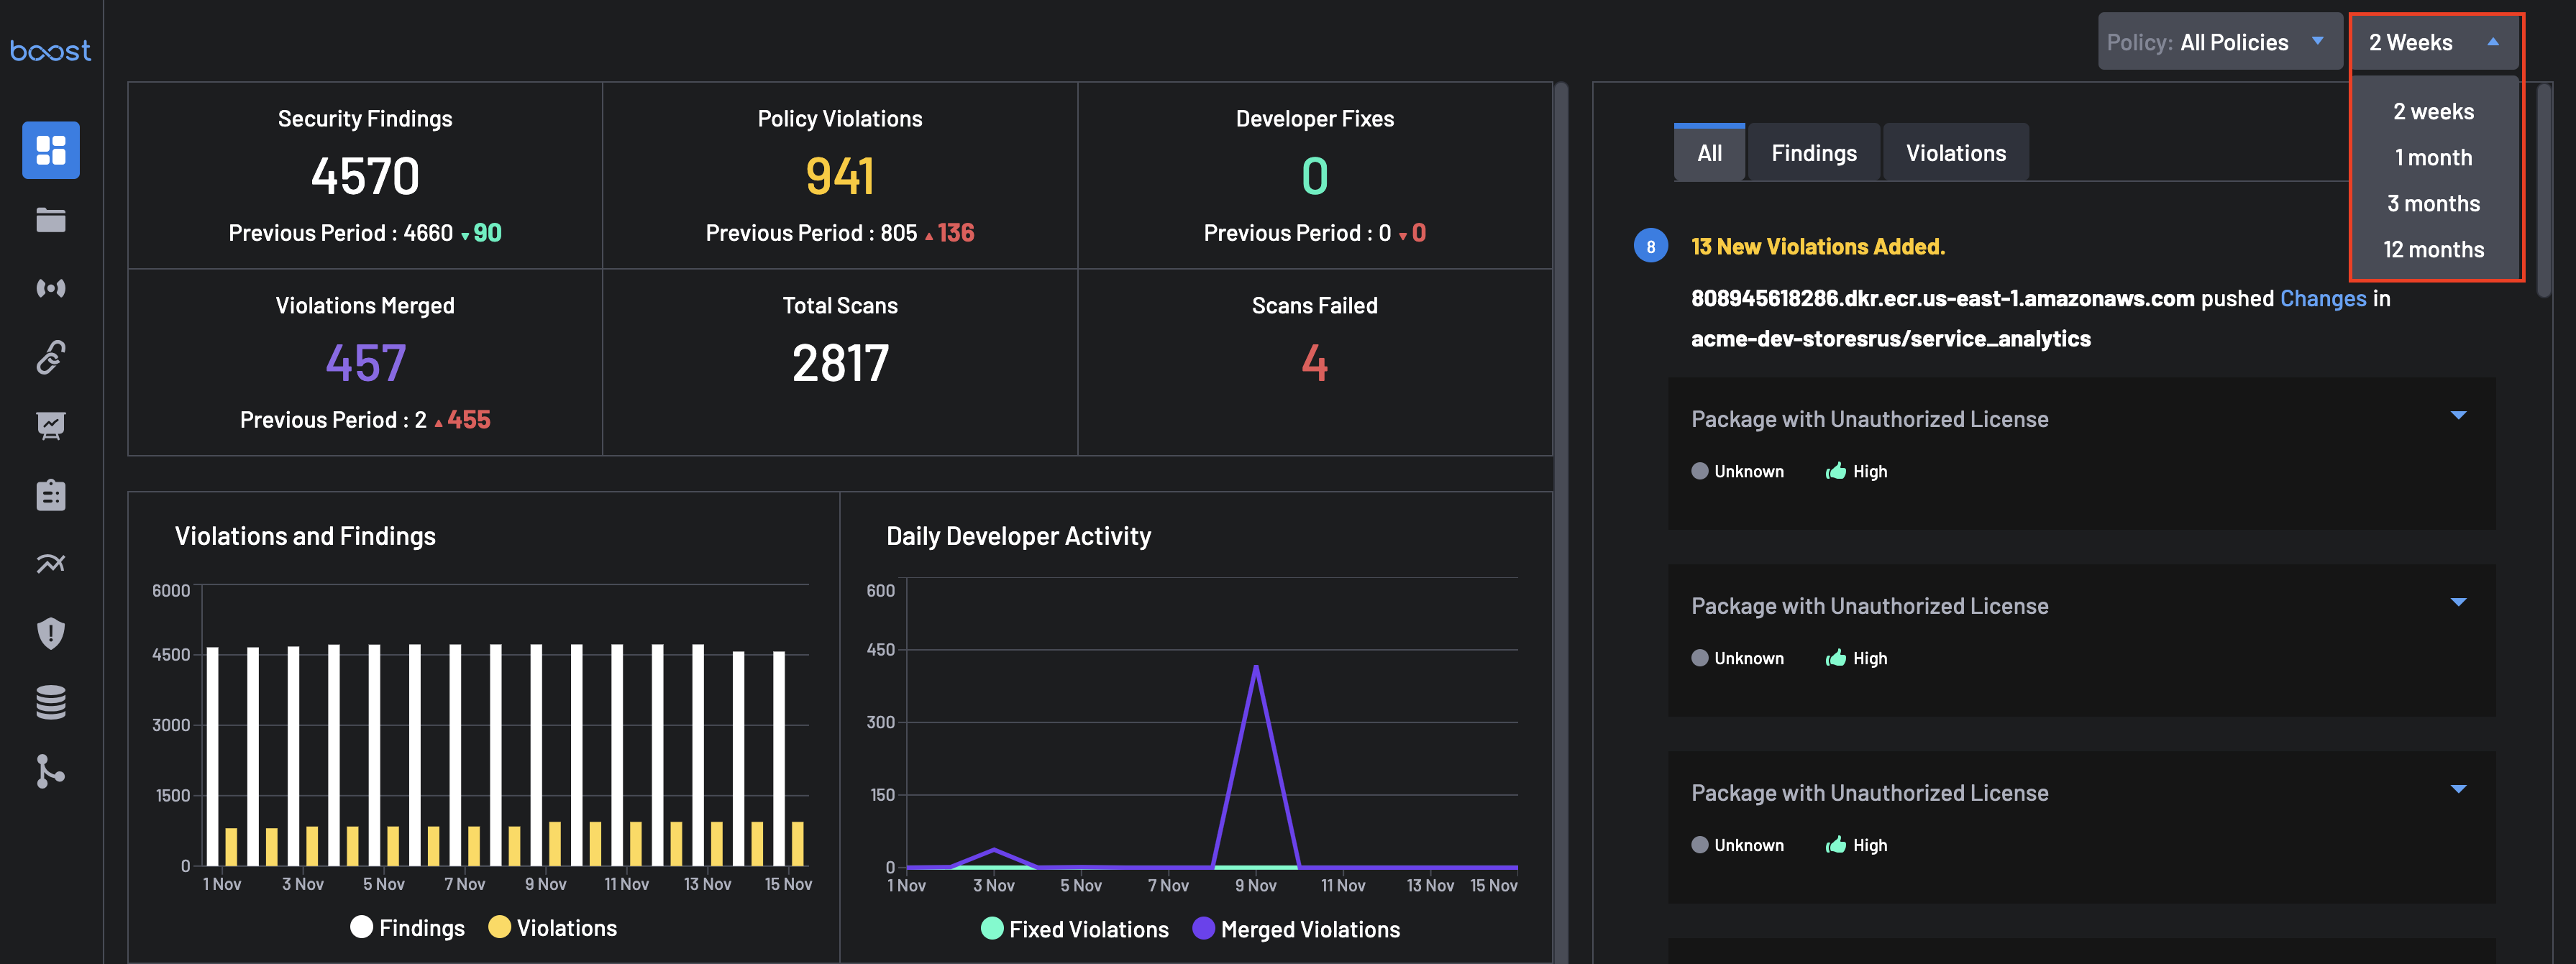
-
Time Filter: Located next to the Manual Tag filter, this allows users to select the time range for the displayed data (e.g., 2 weeks, 1 month, 3 months, or 12 months).
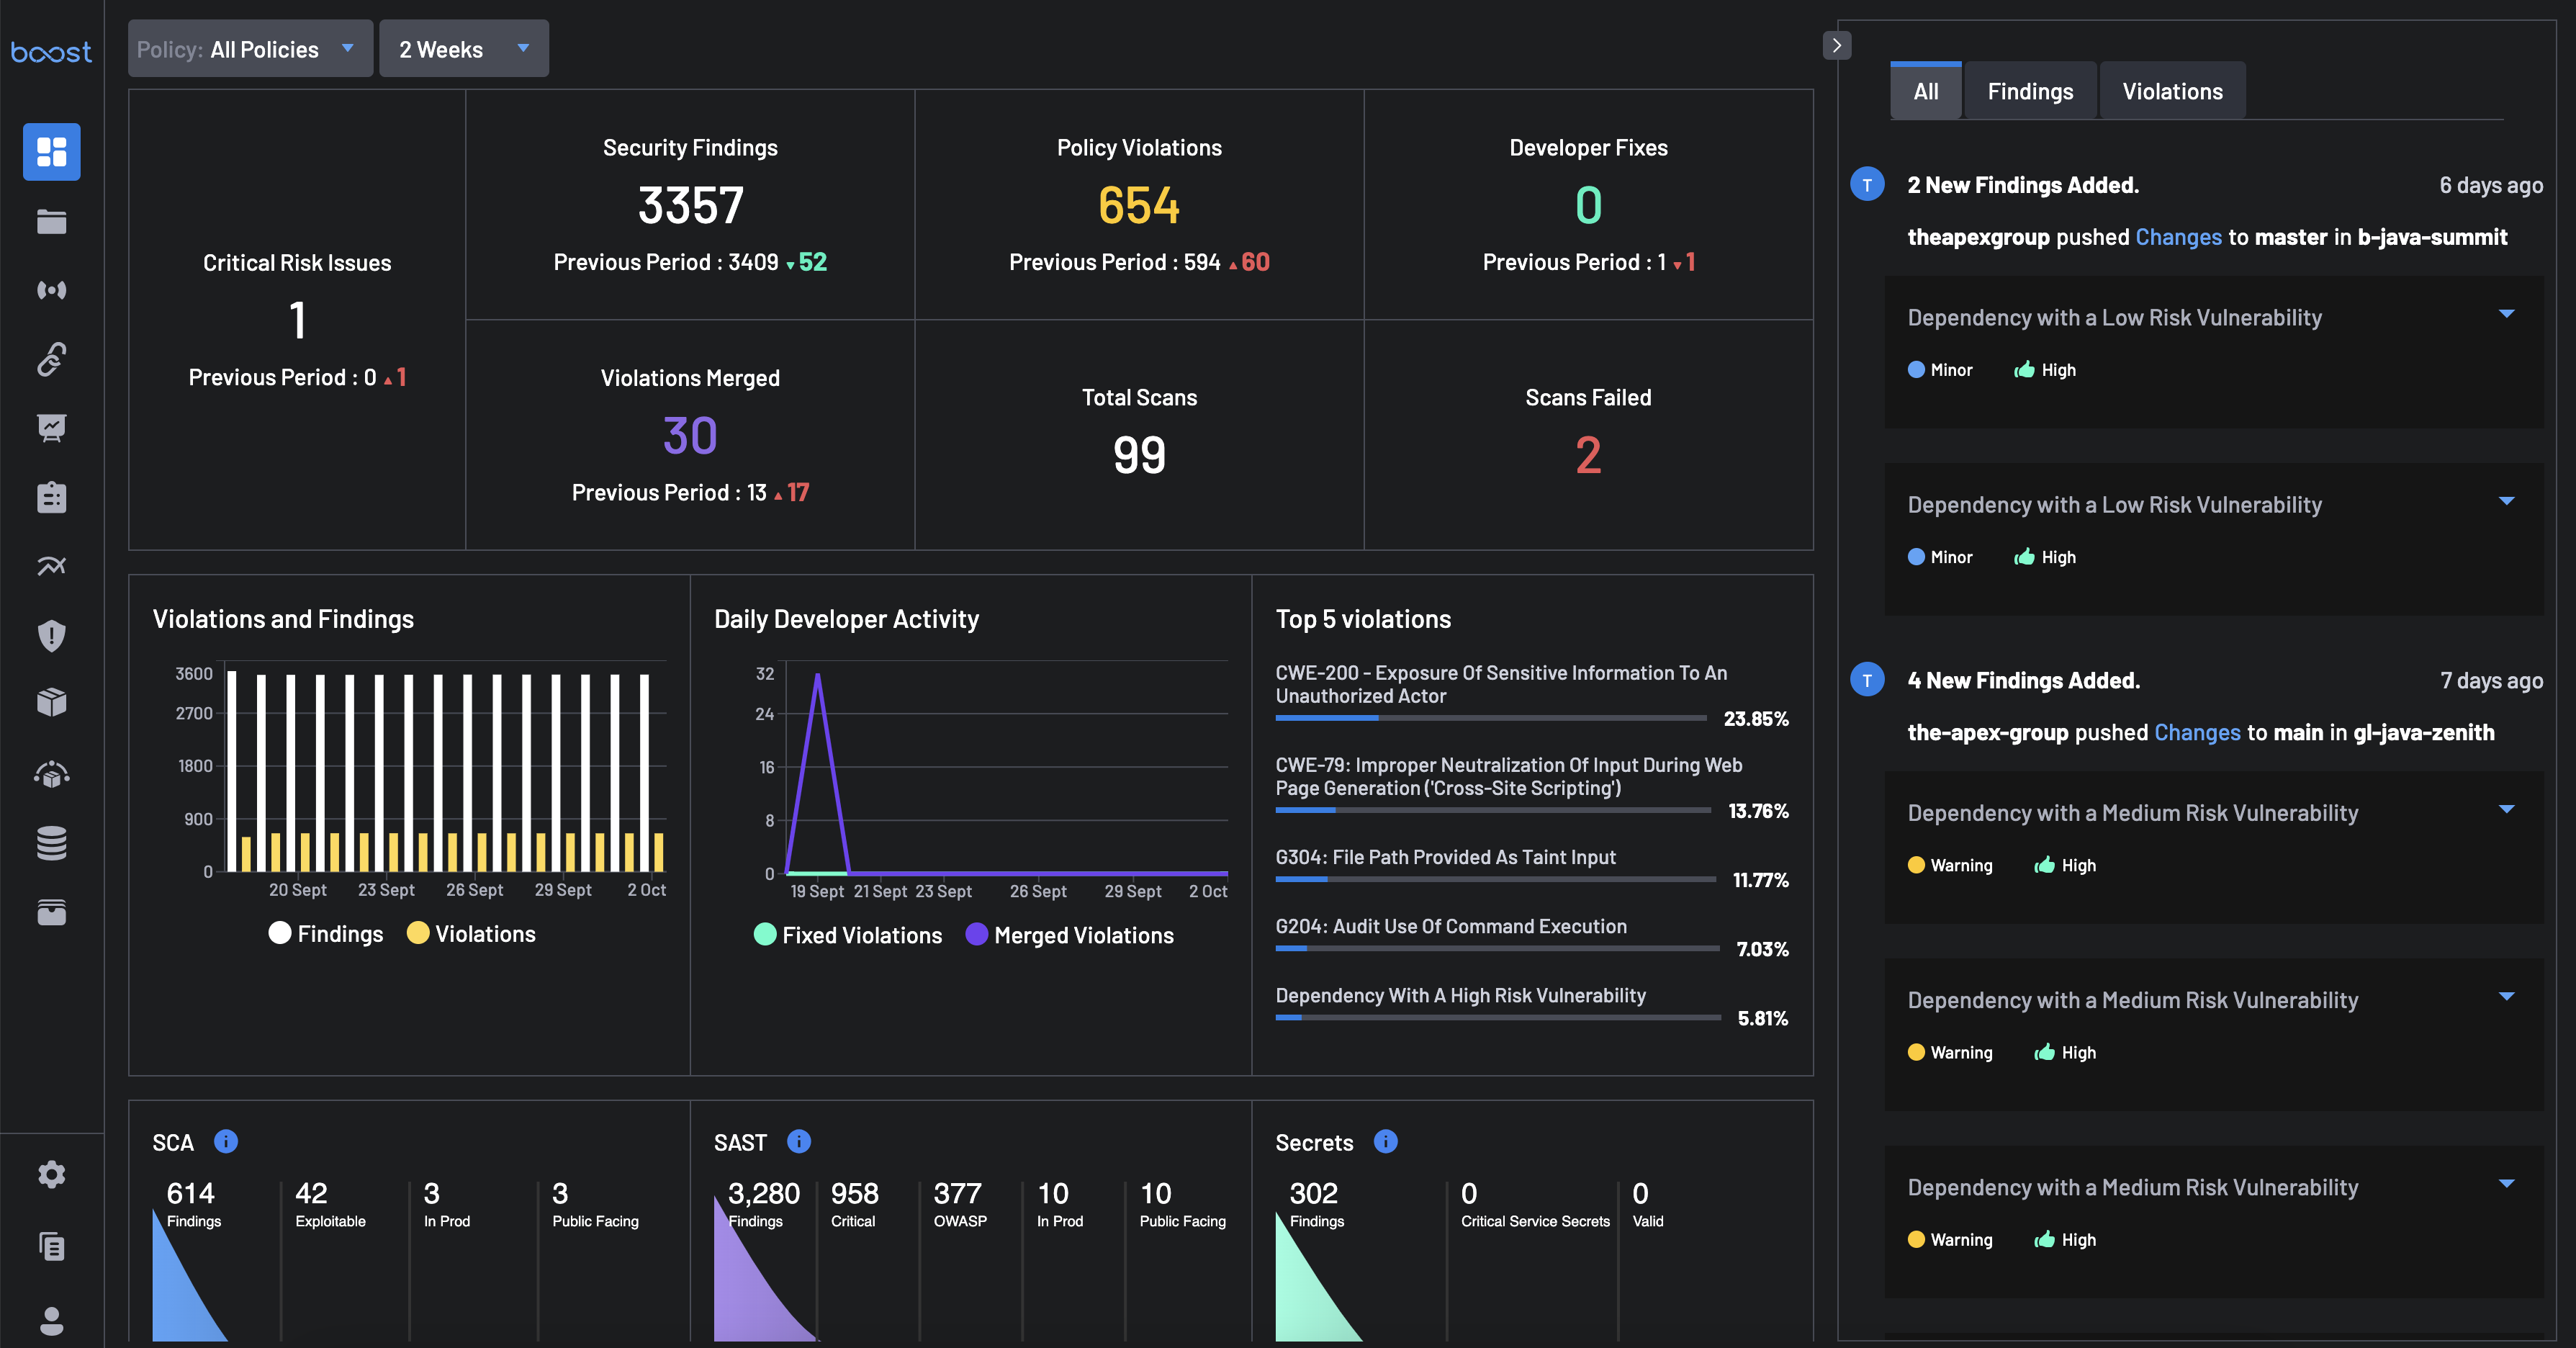
Key Metrics

- Critical Risk Issues: Displays the number of critical risk issues based on the selected policy, manual tags, or time filters. These are high-severity issues that can cause significant damage if left unaddressed and require immediate attention.
- Security Findings: Shows the total number of security findings detected, filtered by the currently selected policy, tags, and timeframe. Includes comparisons to the previous period and highlights any changes in volume.
- Policy Violations: Reflects the number of policy violations detected based on the applied dashboard filters. The metric also includes trend data comparing current and previous filtered periods.
- Developer Fixes: Indicates how many developer-applied fixes have been recorded, based on the active policy, tag, or time filters. Includes comparison to prior activity under the same filtering conditions.
- Violations Merged: Represents the number of policy violations that were merged into the codebase, filtered according to the current dashboard selections.
- Total Scans: The total number of scans performed on repositories, as determined by the selected filters.
- Scans Failed: The count of scans that failed execution, filtered by the policy, tag, or time selections.
Visualizations
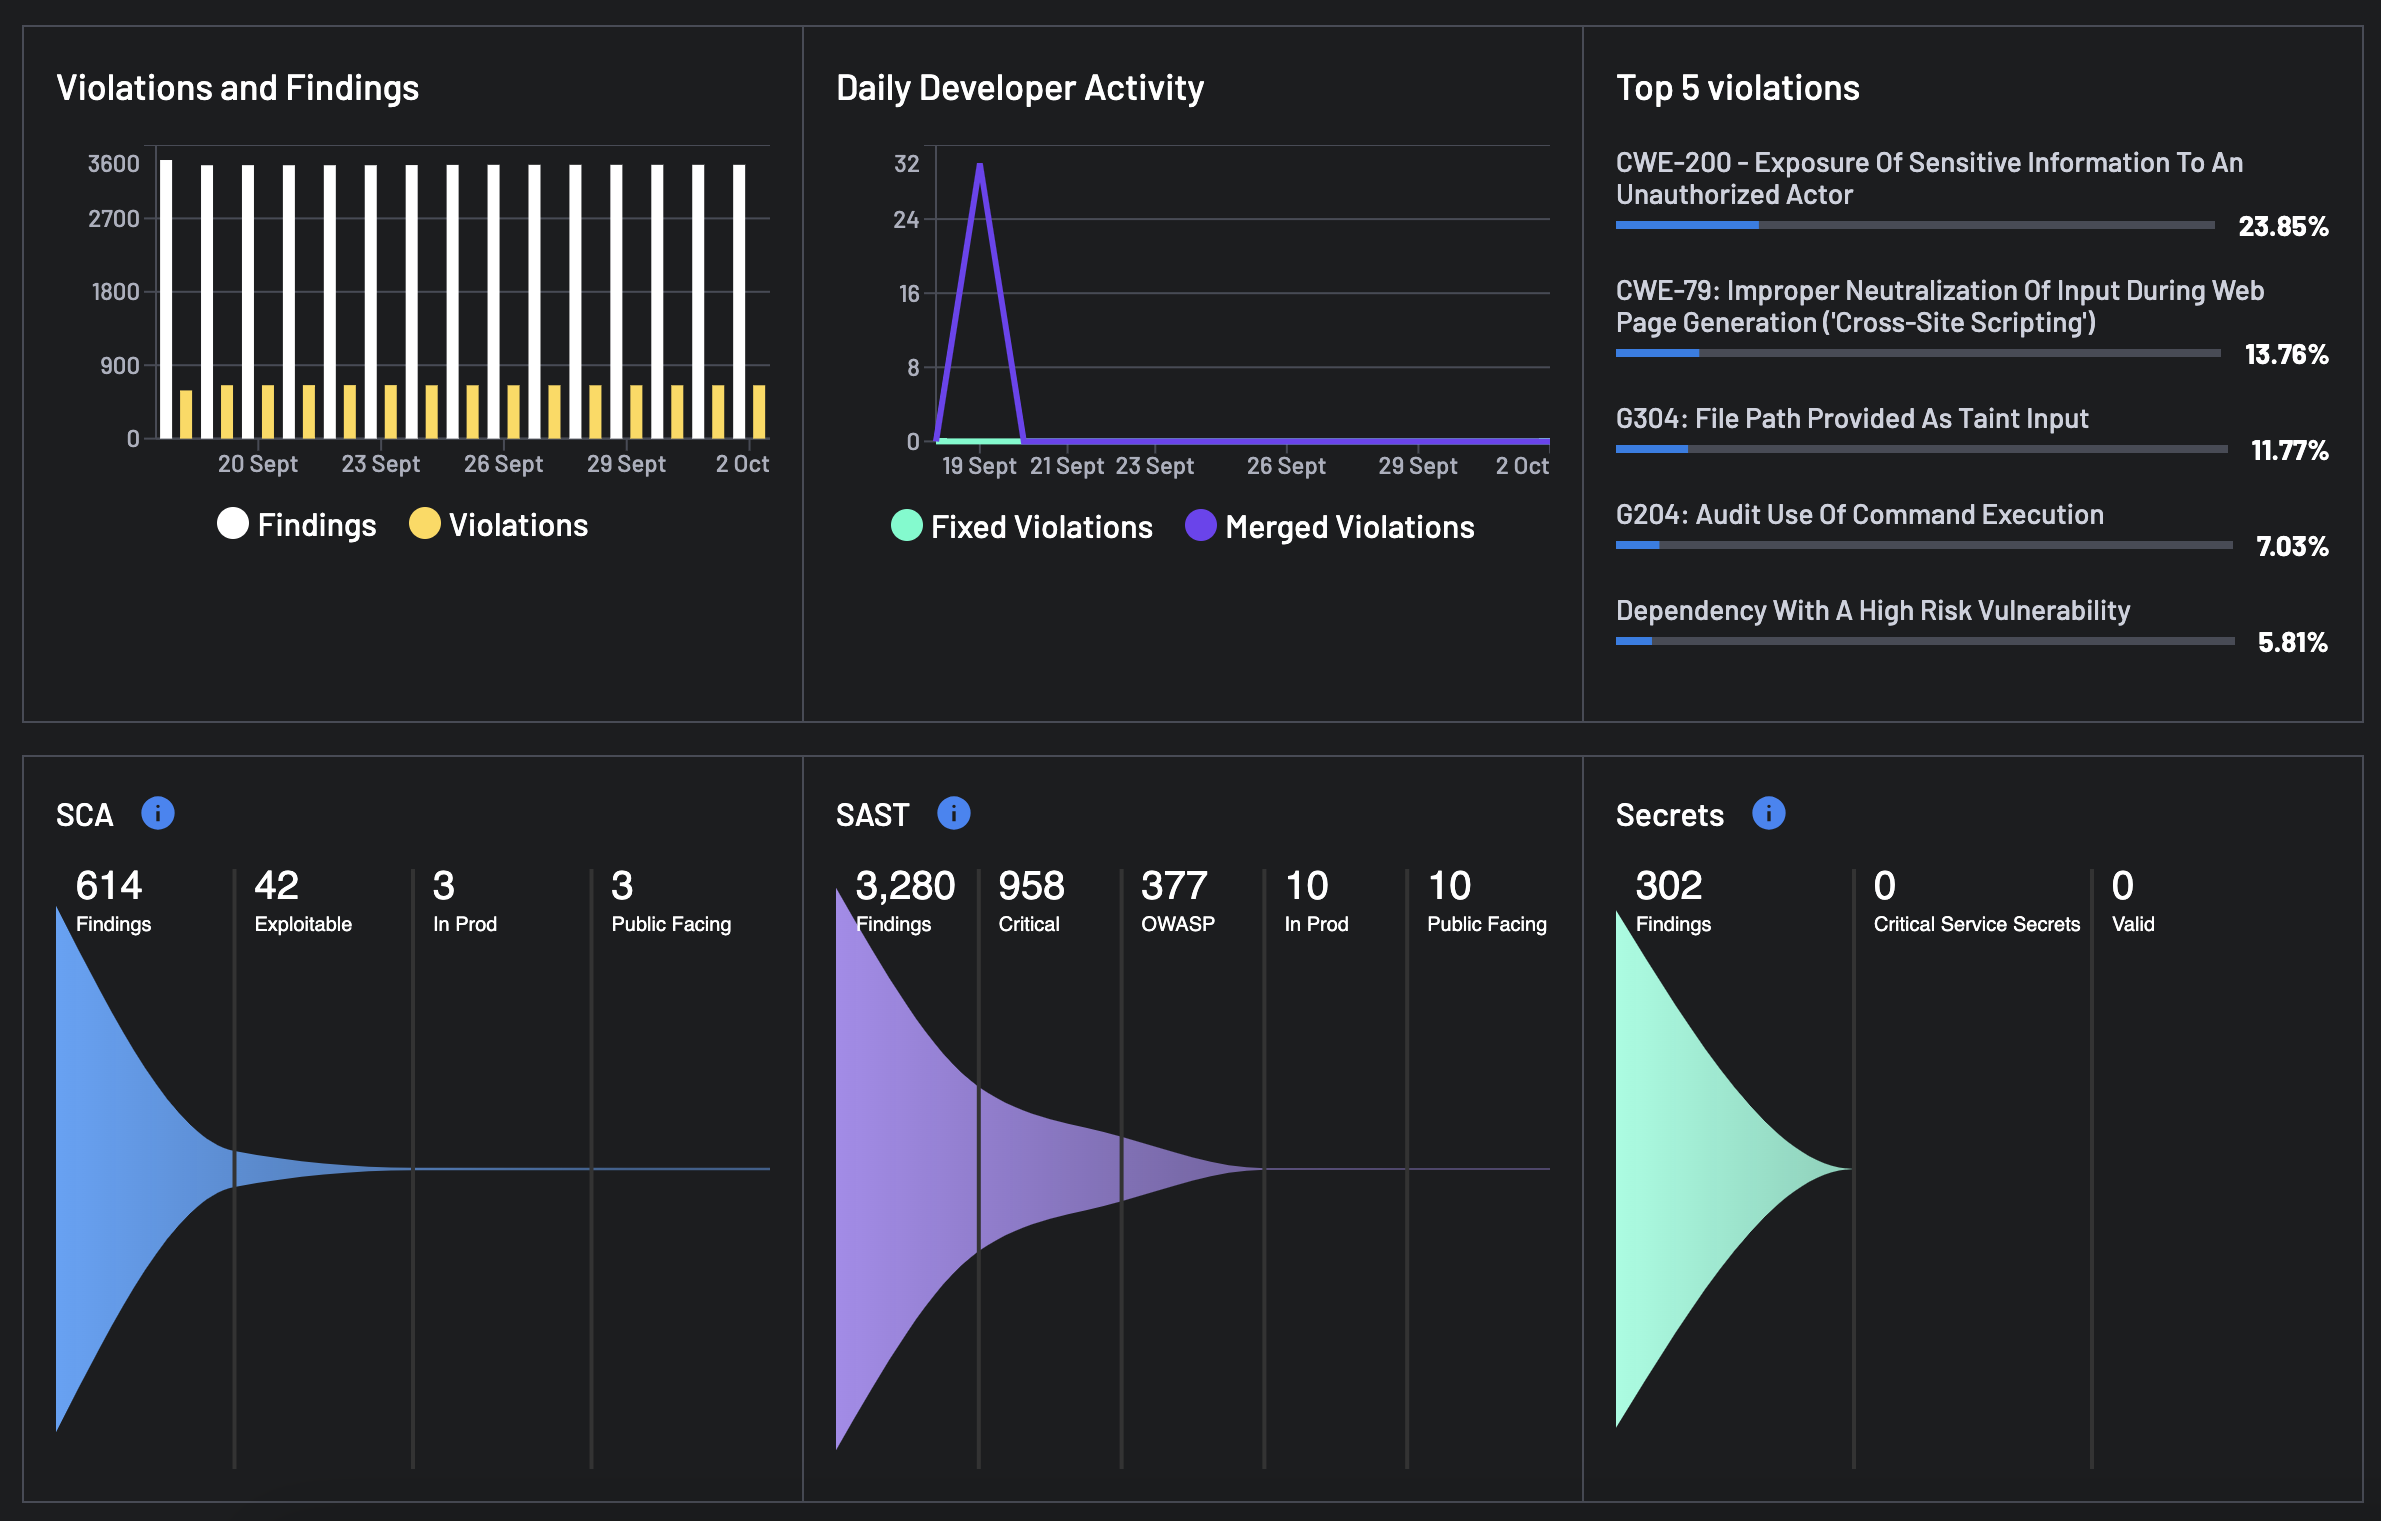
- Violations and Findings Chart: A bar chart showing the daily count of findings (white bars) and violations (yellow bars) based on the applied dashboard filters.
- Daily Developer Activity Chart: A line chart indicating the daily number of fixed violations (green line) and merged violations (purple line) based on the applied dashboard filters.
- Top 5 Violations: A list showing the top 5 most common violations, their descriptions, and their occurrence percentages.
-
Funnel Graph: The Funnel Graph is a powerful addition to the Boost Security dashboard, designed to help you visualize how Boost effectively reduces noise from your security data. This section provides three distinct funnel graphs, each dedicated to a specific type of data:
- SCA (Software Composition Analysis)
- SAST (Static Application Security Testing)
- Secrets
Each funnel graph simplifies the process of sifting through large volumes of security data, ensuring that your team can respond swiftly and effectively to the most pressing security concerns.
Activity Feed
- Findings and Violations Tabs: Located on the right side, allowing users to toggle between viewing all items, only findings, or only violations.
- Activity Entries: Displays recent findings and violations, including:
- Time: The time when the finding or violation was added.
- Repository: The repository where the issue was detected.
- Details: A brief description of the issue, including the type of vulnerability and its severity.
Using the Dashboard
- Filtering Data: Use the policy and time filters at the top to customize the data displayed on the dashboard.
- Monitoring Key Metrics: Regularly review the key metrics to stay informed about the overall security health and recent trends.
- Analyzing Visualizations: Use the charts to understand the distribution of findings and violations over time and identify any spikes or patterns.
- Reviewing Activity Feed: Check the activity feed for the latest findings and violations, focusing on high-severity issues for immediate action.
Practical Applications
- Security Monitoring: Keep track of the number and types of security findings and policy violations to ensure proactive management.
- Trend Analysis: Analyze the visualizations and key metrics to identify trends and patterns in security issues and developer activities.
- Actionable Insights: Use the top 5 violations list and activity feed to prioritize remediation efforts and address the most critical vulnerabilities first.
Conclusion
The Boost Security dashboard provides a comprehensive overview of your security landscape, enabling you to make informed decisions and take timely actions to enhance the security of your repositories.