Posture Reports
The Report page in Boost Security provides a centralized view of your organization’s current security posture. It visualizes and summarizes violations, findings, risk levels, and trends detected across integrated scanning tools and security policies. It enables DevSecOps teams, security engineers, and compliance officers to quickly identify areas of high risk, monitor changes over time, and take remediation actions.
Reports are filterable by Resource Type, Scanner, Manual Tag, and Time Period, offering flexibility in how posture data is viewed and analyzed.
The Report page shows the following metrics:
Current Snapshot
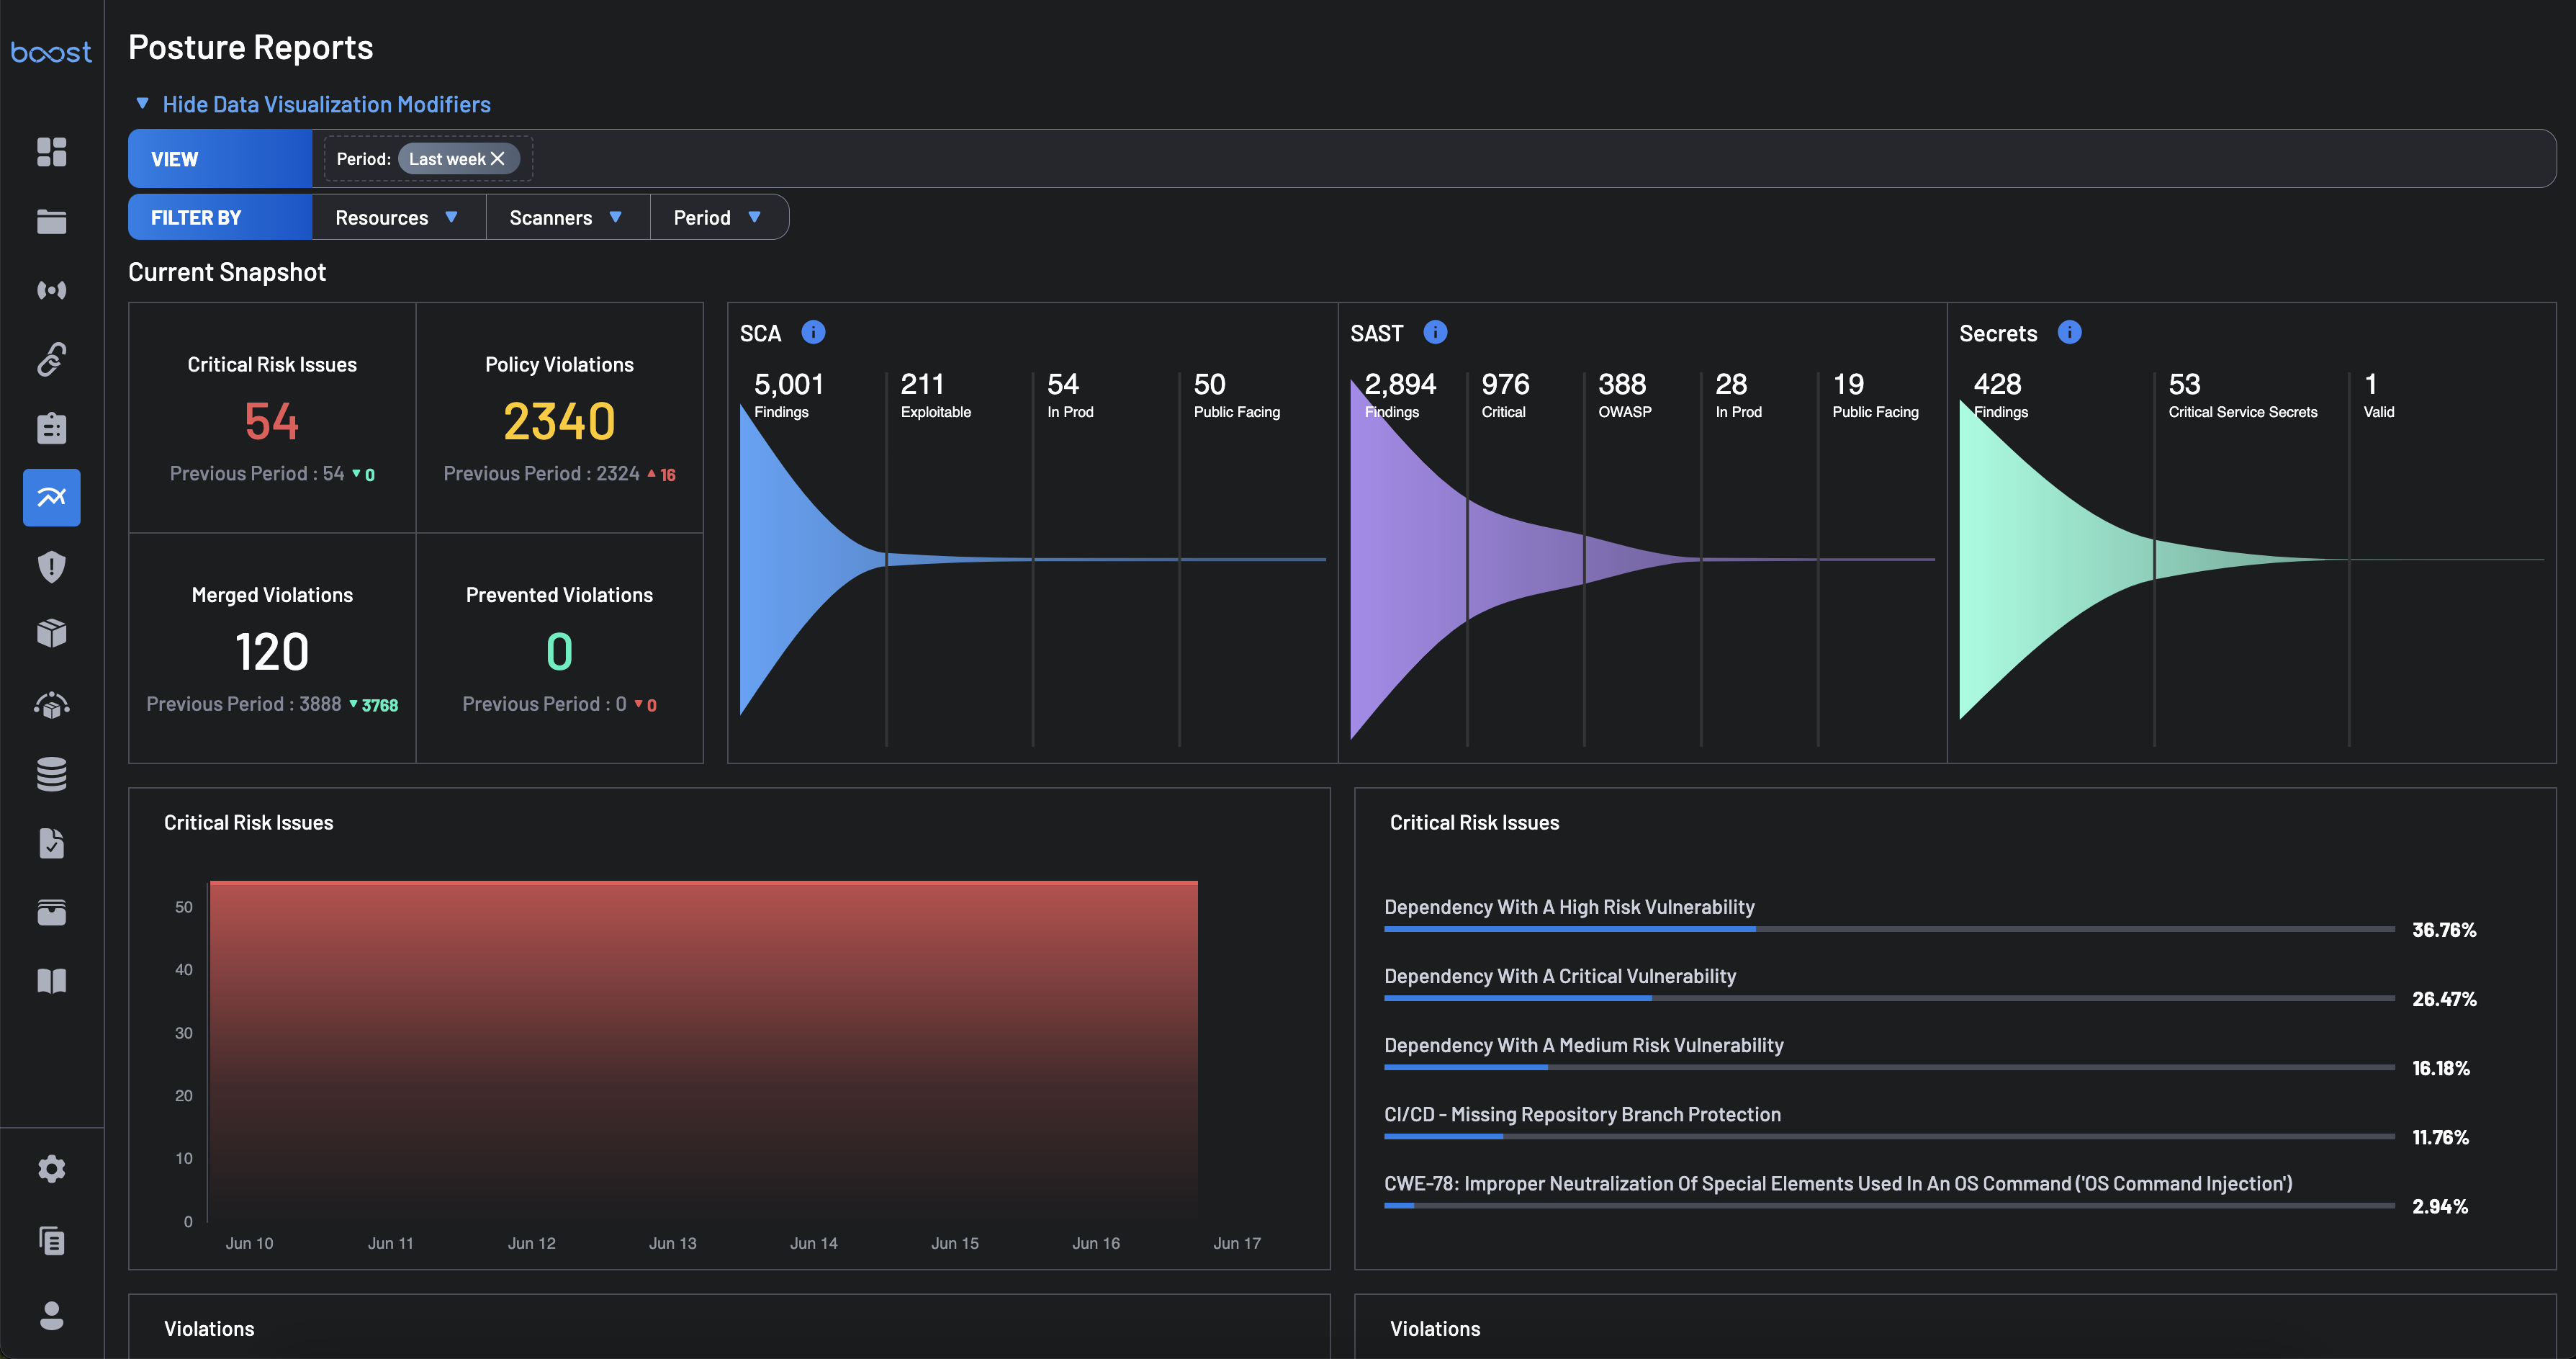
This section offers a high-level summary of the key posture metrics:
-
Critical Risk Issues: These are issues that have been identified by Boost as posing a particularly significant risk to your security posture based on a combination of criteria. Some examples of Critical Risk Issues are open source findings with a very high Exploit Prediction score that exist within your runtime environment with a service that has public access to the internet, or missing branch protection on a repository that has no restrictions on public contribution.
-
Policy Violations: Total count of violations to your organization's assigned security policies within Boost.
-
Merged Violations: Violations that have been newly created within Boost within the configured time frame for this report view.
-
Prevented Violations: Policy violations that were detected within a PR, but were resolved prior to that PR merging into the default branch. This count represents the violations that would have been created had a developer not updated their PR prior to commit to remove the detected vulnerability.
Scanner Breakdown
Each scanner category (SCA, SAST, Secrets) provides insights on the findings and how critical they are:
-
SCA (Software Composition Analysis)
- Findings: Total issues detected from open-source components.
- Exploitable: Those findings with a higher likelihood of being attacked based on the EPSS score of the vulnerability.
- In Prod: Affected assets currently deployed in production.
- Public Facing: Affected assets are exposed externally.
Note
In Prod and Public Facing data are only available if runtime enrichment has been enabled within Boost through our Kubernetes, Wiz, or Dynatrace connectors.
-
SAST (Static Application Security Testing)
- Findings: Total issues detected.
- Critical: High-risk vulnerabilities in source code.
- OWASP: Matches OWASP Top 10 issues.
- In Prod: Affected assets currently deployed in production.
- Public Facing: Affected assets are exposed externally.
Note
In Prod and Public Facing data are only available if runtime enrichment has been enabled within Boost through our Kubernetes, Wiz, or Dynatrace connectors.
-
Secrets
- Findings
- Critical Service Secrets: These are secrets which Boost can positively identify as belonging to a specific service or API. For example, a Slack Access Token would be an example of a Critical Service Secret because we can automatically identify those. Boost is able to classify over 100 different unique secret types.
- Valid: For some Critical Service Secrets, Boost is able to make a call to the identified service to ask if the secret detected is still active. If a secret is determined to still be active, this creates a Critical Risk Issue, as well as updates the finding with that information for automation and policy evaluation. It should be noted that this validation is done entirely from within your SCM environment and at no time is your secret available to Boost.
Critical Risk Issues
This section presents the details of critical risk issues in a bar chart, along with the top 5 critical issues.
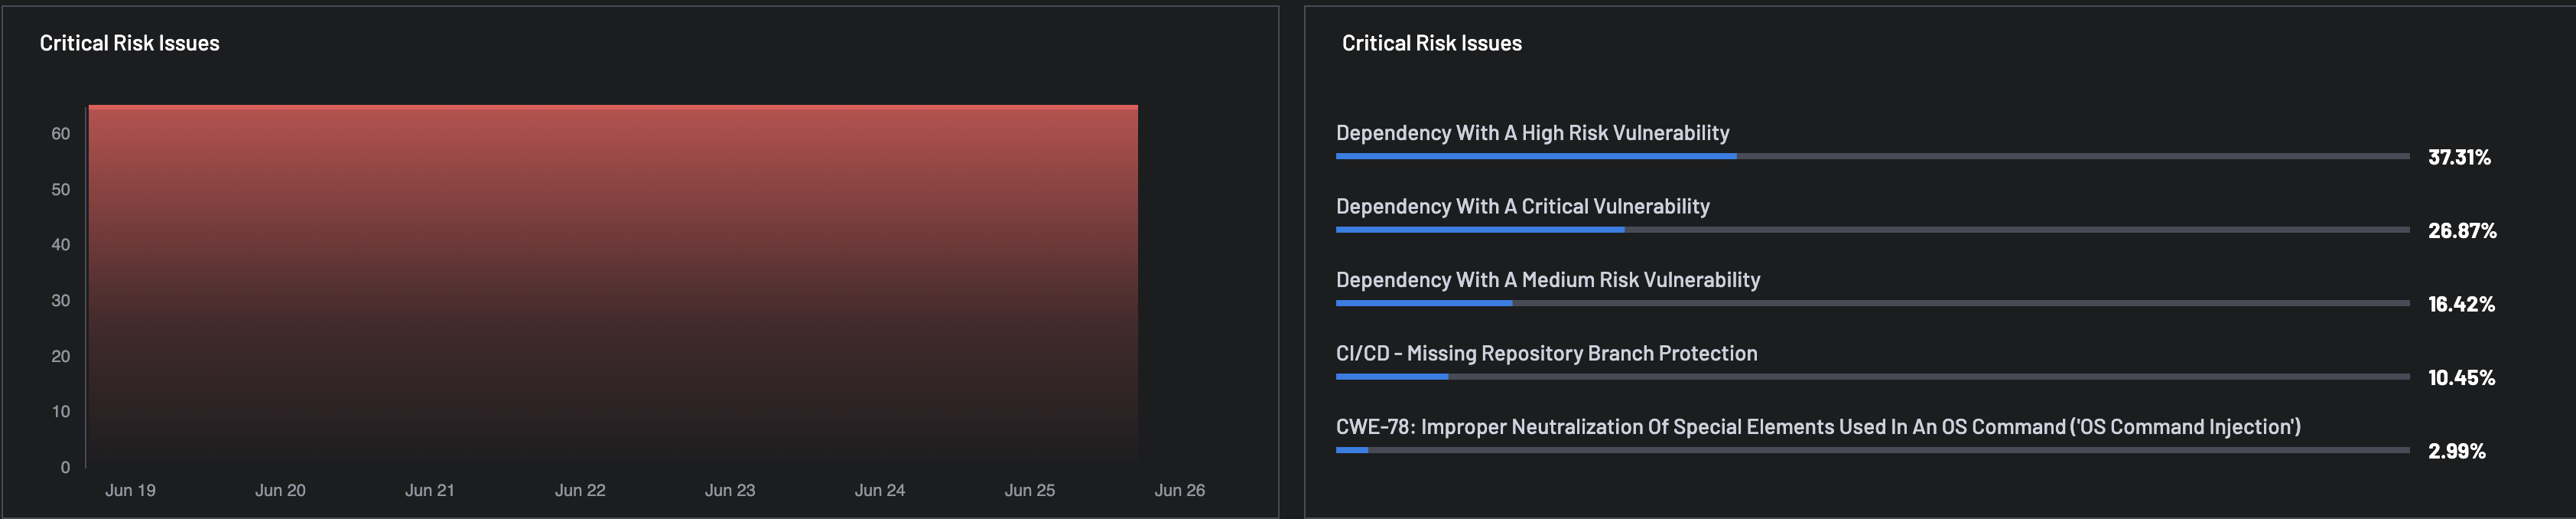
- Bar Chart: A time-series view of critical risk issues over a selected date range (e.g., June 10–17). Helps track remediation progress or incident spikes.
- Critical Risk Categories (Top 5): Shows the percentage share of the top 5 critical issues across vulnerability categories, e.g, Dependency With A High Risk Vulnerability, Dependency With A Critical Vulnerability, etc.
Violations & Findings
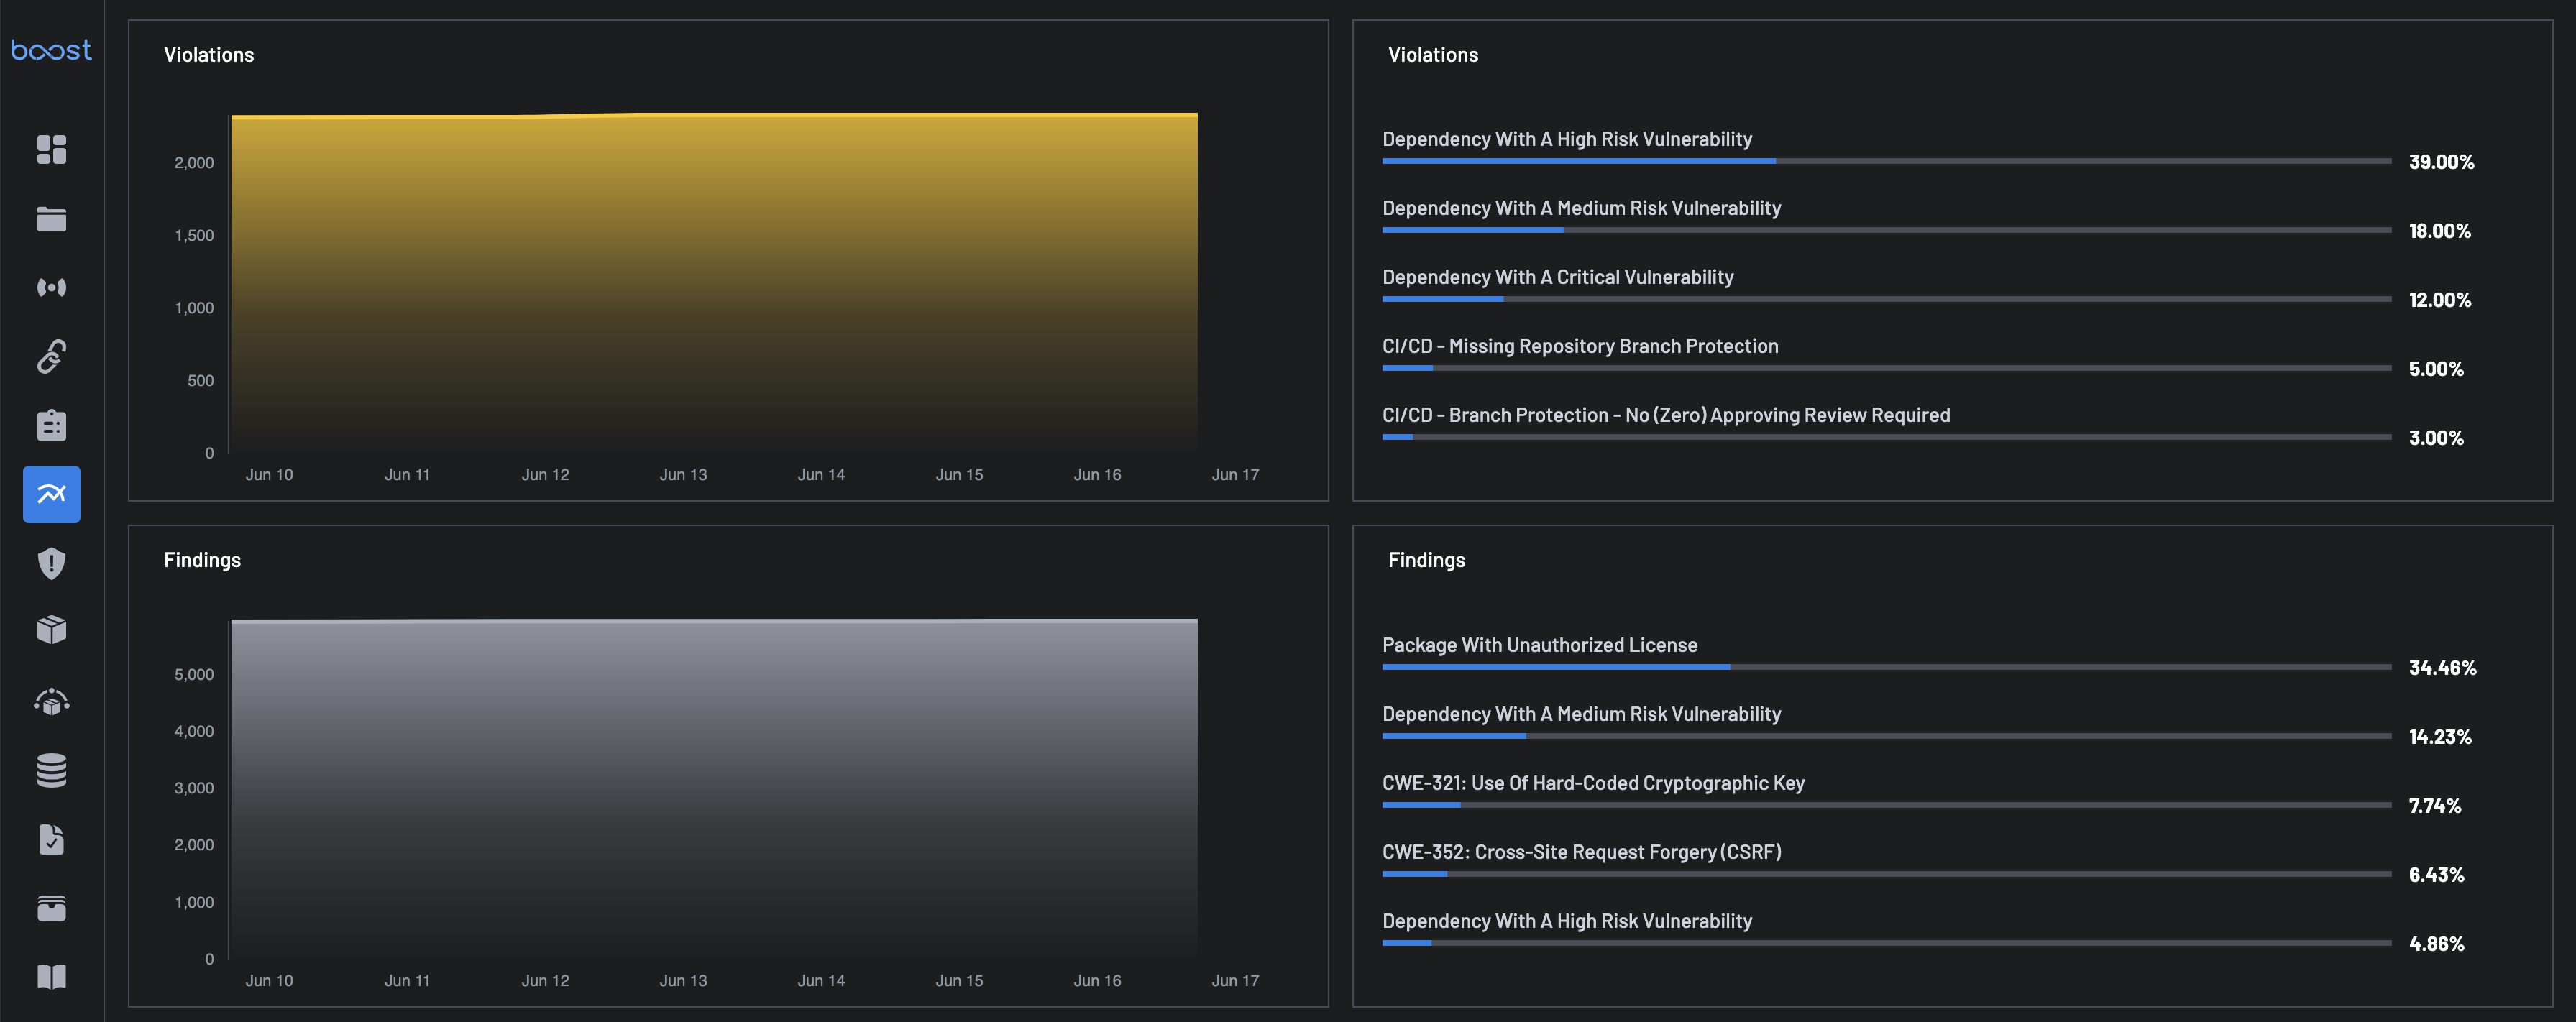
-
Violations Trend Graph: This chart visualizes how the number of security violations has changed over time - highlighting spikes, drops, or patterns in vulnerability introduction or remediation. It helps security teams monitor progress and identify when new risks are being introduced.
-
Violations Categories: This shows the top 5 violation categories with their corresponding percentage (%) of occurrence, e.g., Dependency With A High Risk Vulnerability, CI/CD – Missing Repository Branch Protection, e.t.c.
-
Findings Trend Graph: This graph displays the total number of findings over time, offering a high-level overview of how security risks, code quality issues, or licensing violations are evolving. This helps identify whether the security posture is improving or deteriorating, and when significant changes or spikes occurred.
-
Finding Categories: This shows the top 5 findings categories, e.g., Package With Unauthorized License, CWE-321: Use Of Hard-Coded Cryptographic Key, e.t.c.
Coverage (Chart)
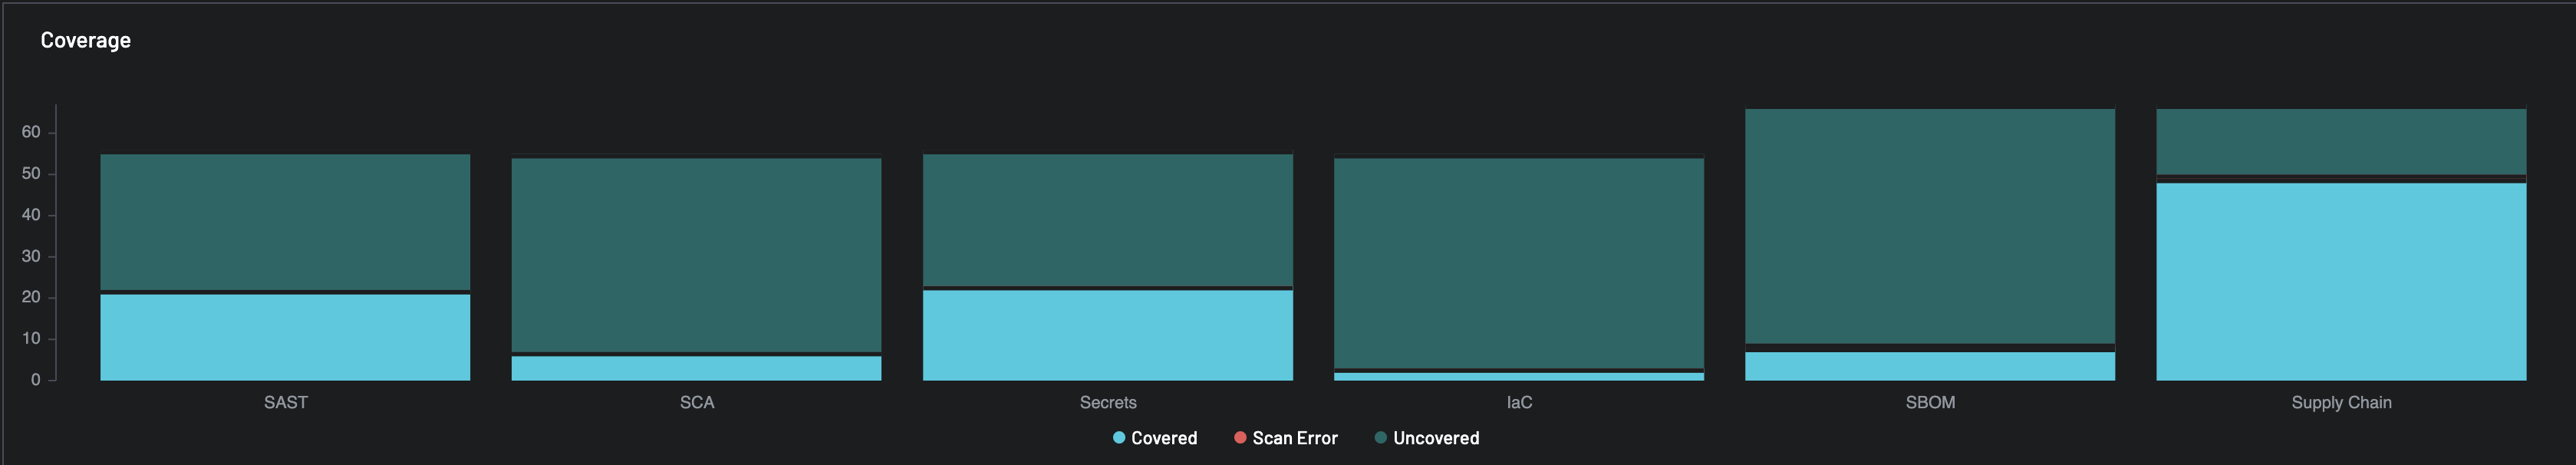
The Coverage chart visualizes scanning coverage across six key security layers:
-
SAST (Static Application Security Testing): Indicates code-level analysis coverage.
-
SCA (Software Composition Analysis): Reflects coverage of open-source components for known vulnerabilities and licensing issues.
-
Secrets Scanning: Shows the extent to which secrets (e.g., API keys, credentials) are identified and secured.
-
IaC (Infrastructure as Code): Assesses the scanning coverage of code used to provision infrastructure (e.g., Terraform, CloudFormation).
-
SBOM (Software Bill of Materials): Identifies the inventory of software components, dependencies, and their scanning coverage.
-
Supply Chain: Measures how comprehensively the system analyzes external software supply chain components.
Each bar highlights the scanning completeness per category to help detect under-tested areas.
Reports by Finding Type
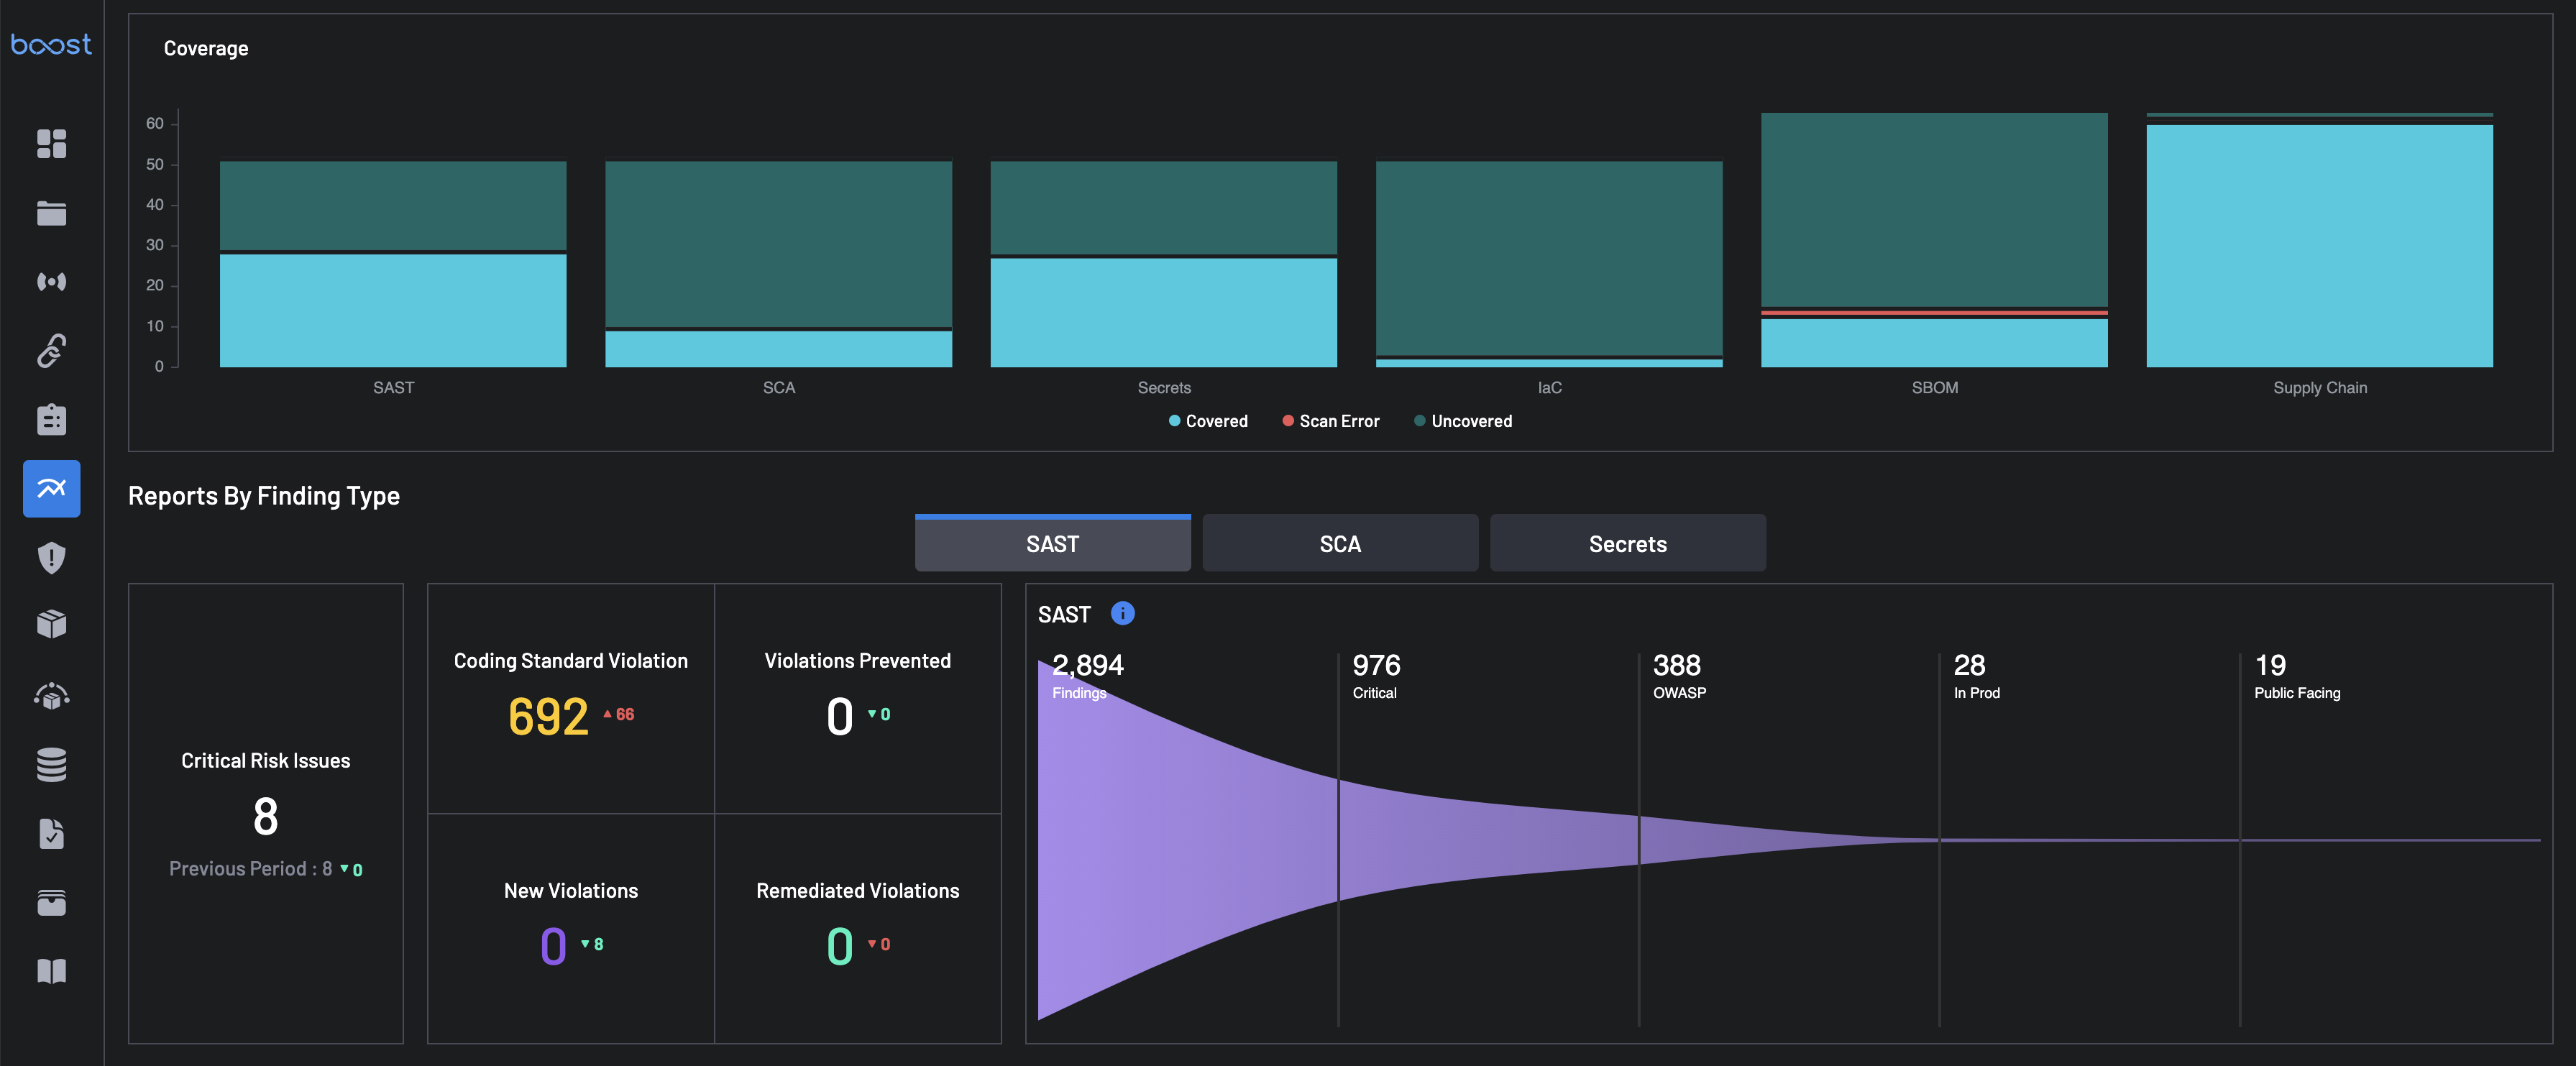
This section provides a breakdown of Findings and Violations grouped by Finding Type: SAST, SCA, and Secrets. For each finding type, these details are provided:
-
Critical Risk Issues: These are issues that have been identified by Boost as posing a particularly significant risk to your security posture based on a combination of criteria. An example of a Critical Risk Issue is an open source findings with a very high Exploit Prediction score that exist within your runtime environment in a service with public access to the internet, or missing branch protection on a repository that has no restrictions on contributors.
-
Coding Standard Violations: These are breaches of internal code quality, security, or style policies enforced within your development workflow. While they may not always present an immediate security threat, they indicate deviations from best practices that can lead to technical debt or future vulnerabilities if left unaddressed.
-
Violations Prevented: Policy violations that were detected within a pull request (PR), but were resolved prior to that PR merging into the default branch. This count represents the violations that would have been created had a developer not updated their PR prior to commit to remove the detected vulnerability.
-
New Violations: These are policy violations newly introduced into the default branch as detected by Boost. They represent issues that were not resolved prior to merge and are now active risks within your codebase.
-
Remediated Violations: Policy violations were detected on the default branch, but were successfully resolved.
Use this view to compare effectiveness across scanning tools for each Finding Type and determine where to focus remediation.
Indepth Analysis for Finding Type
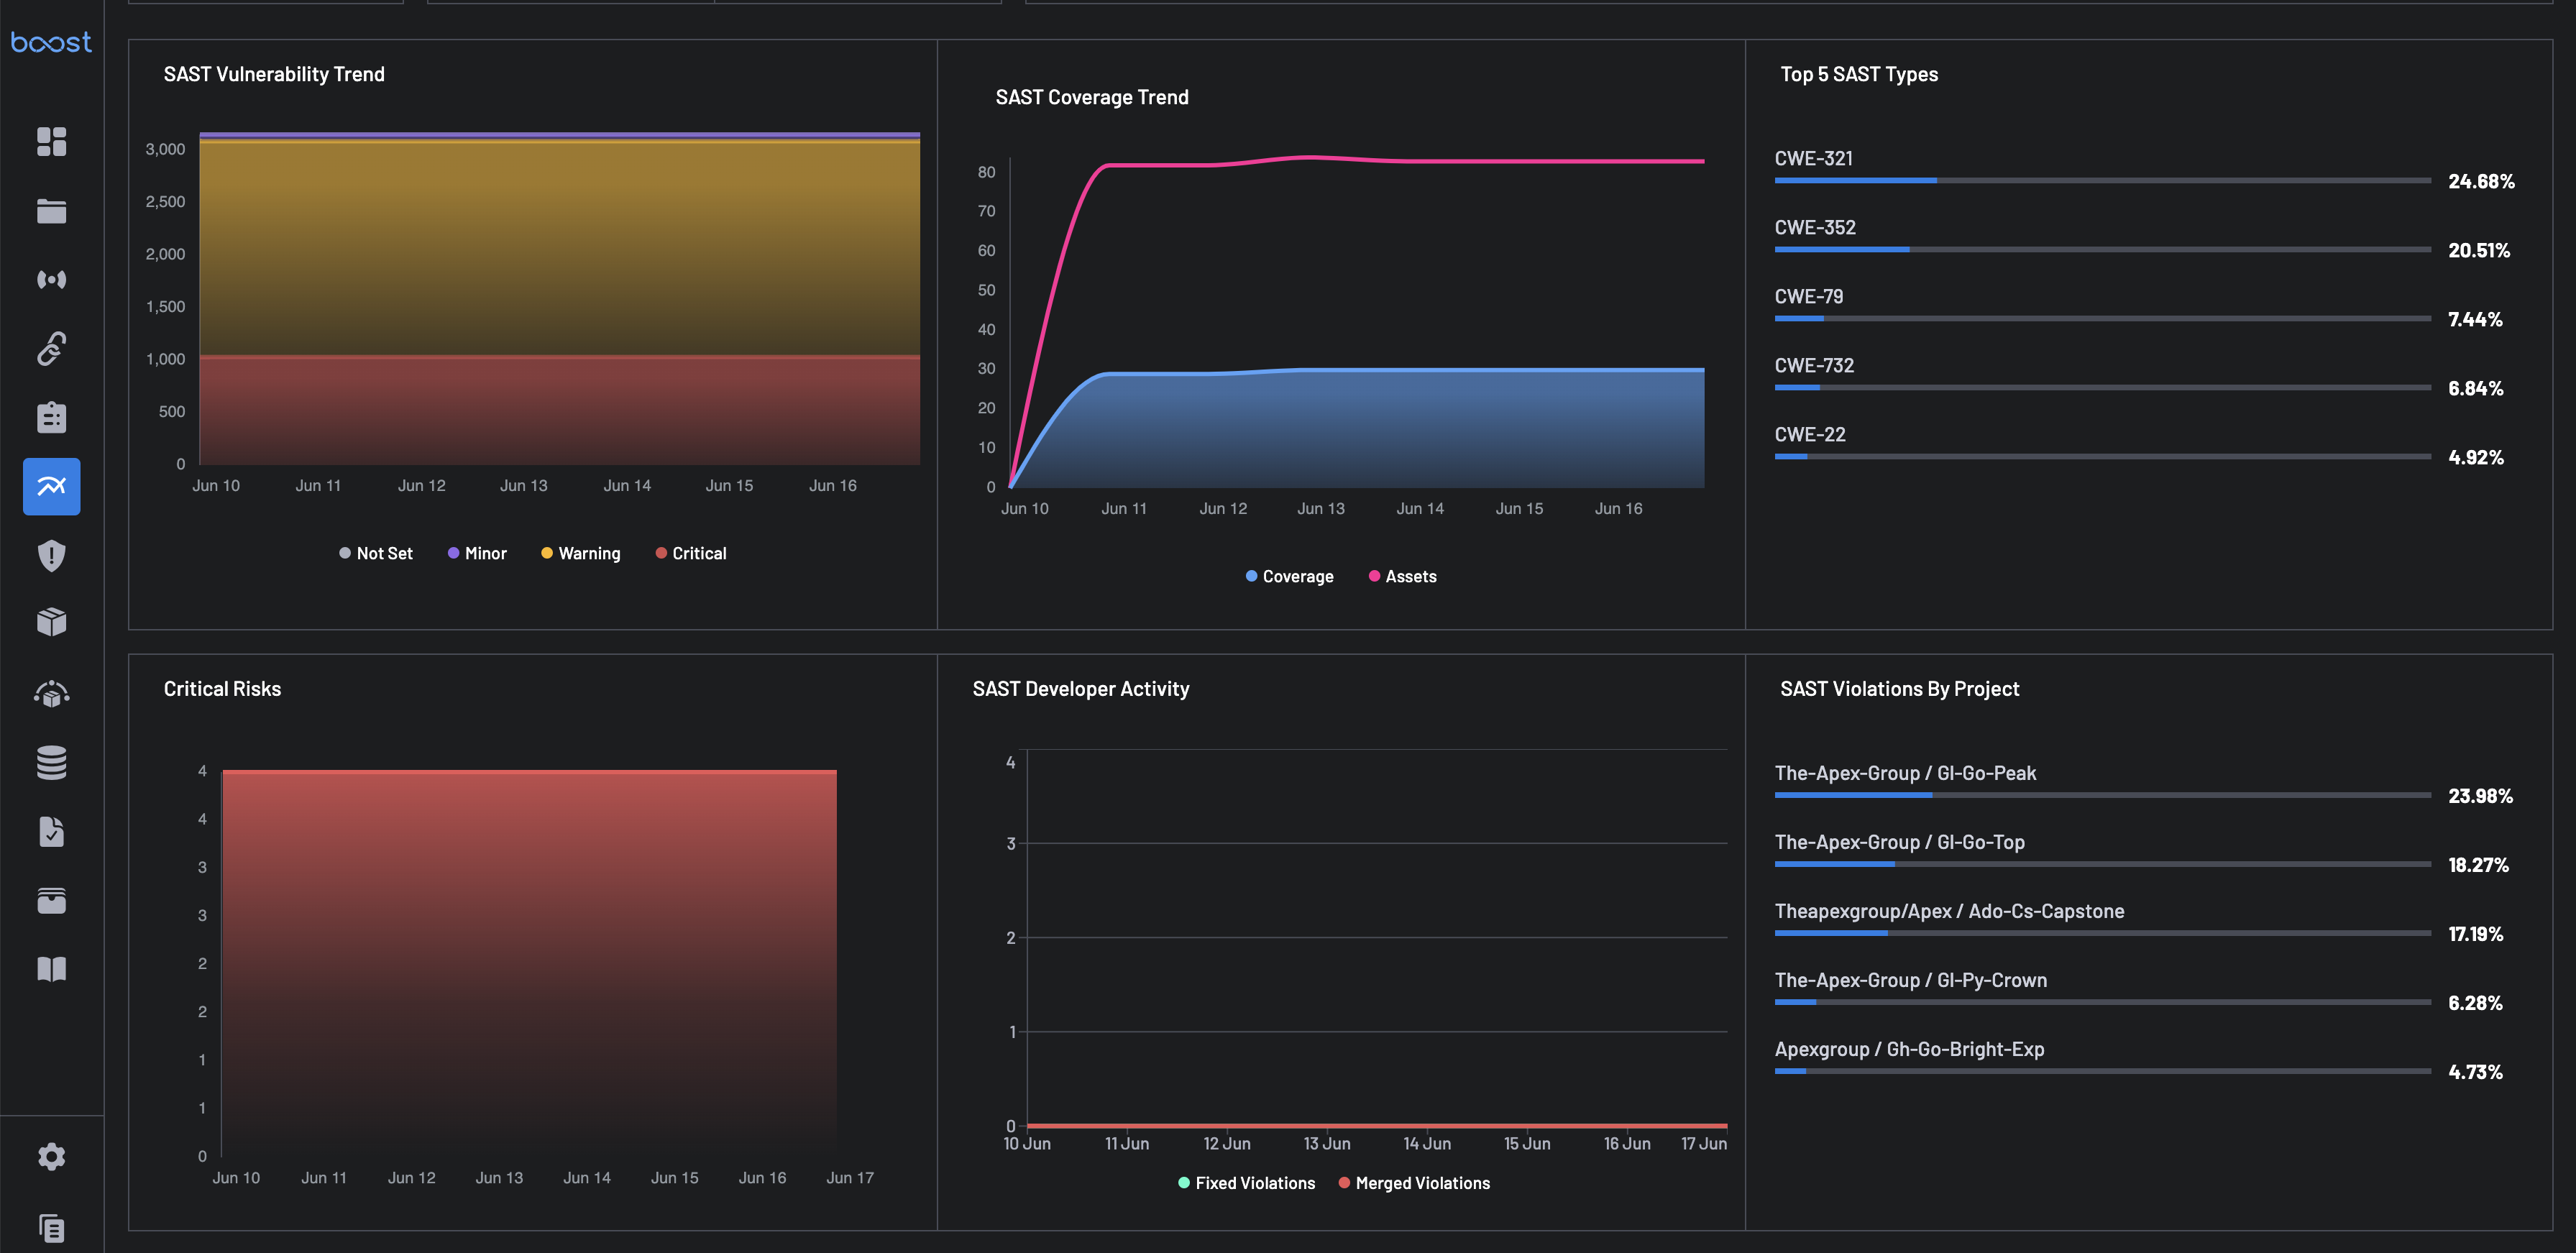
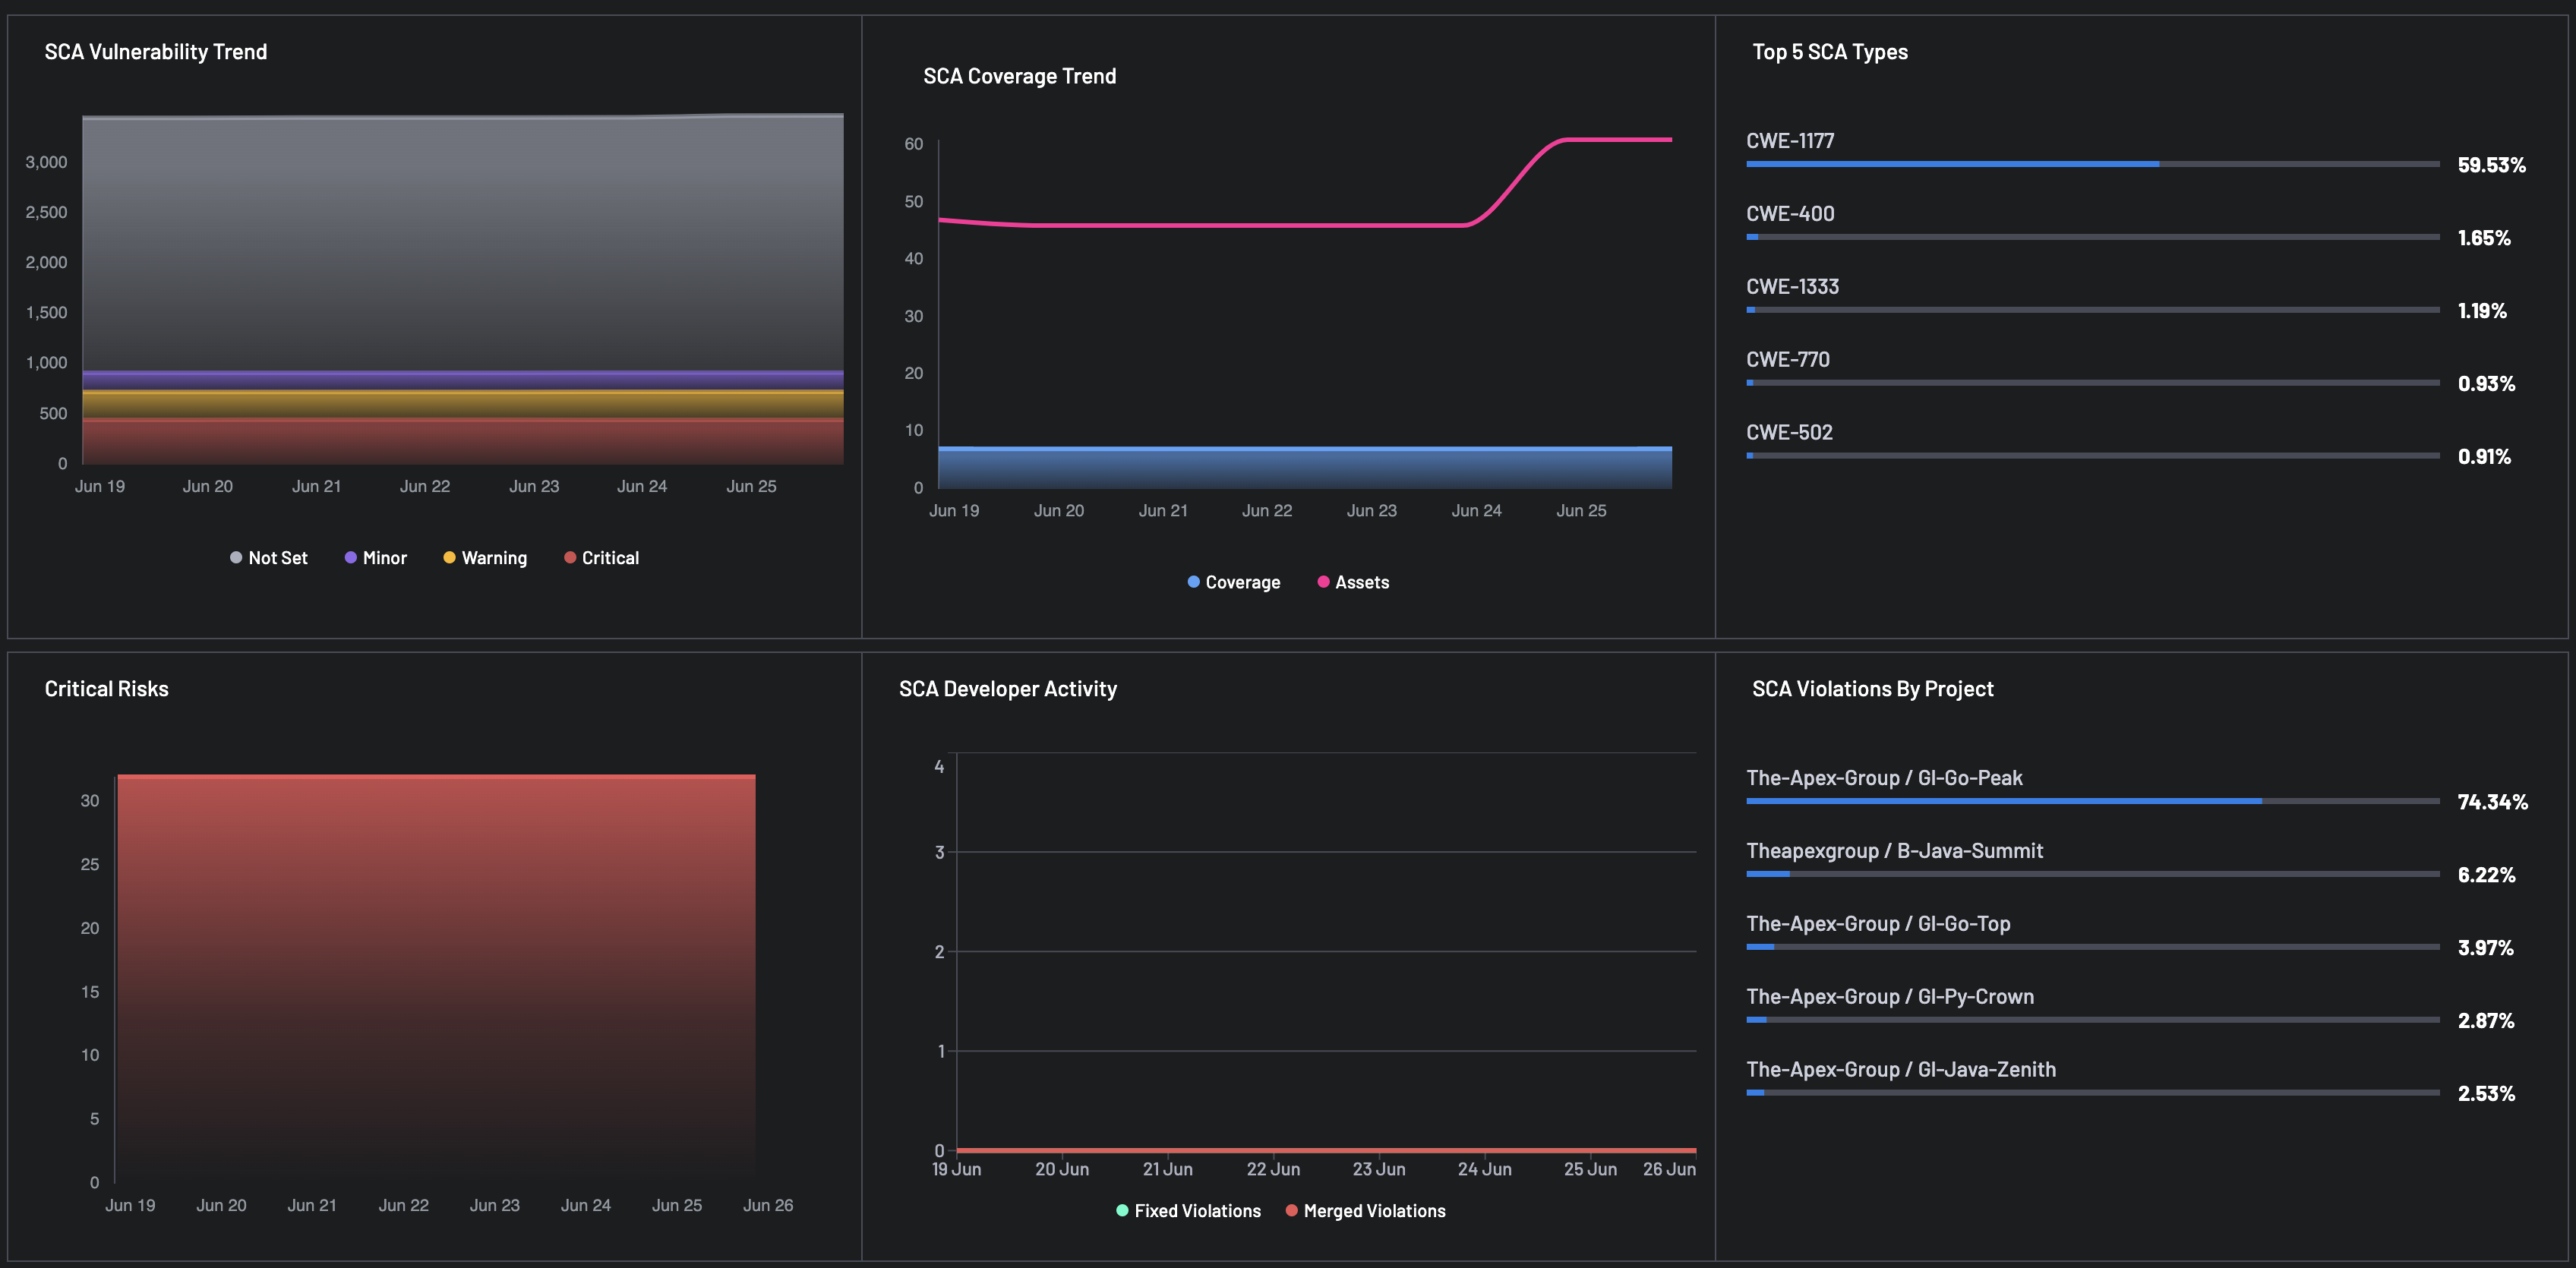
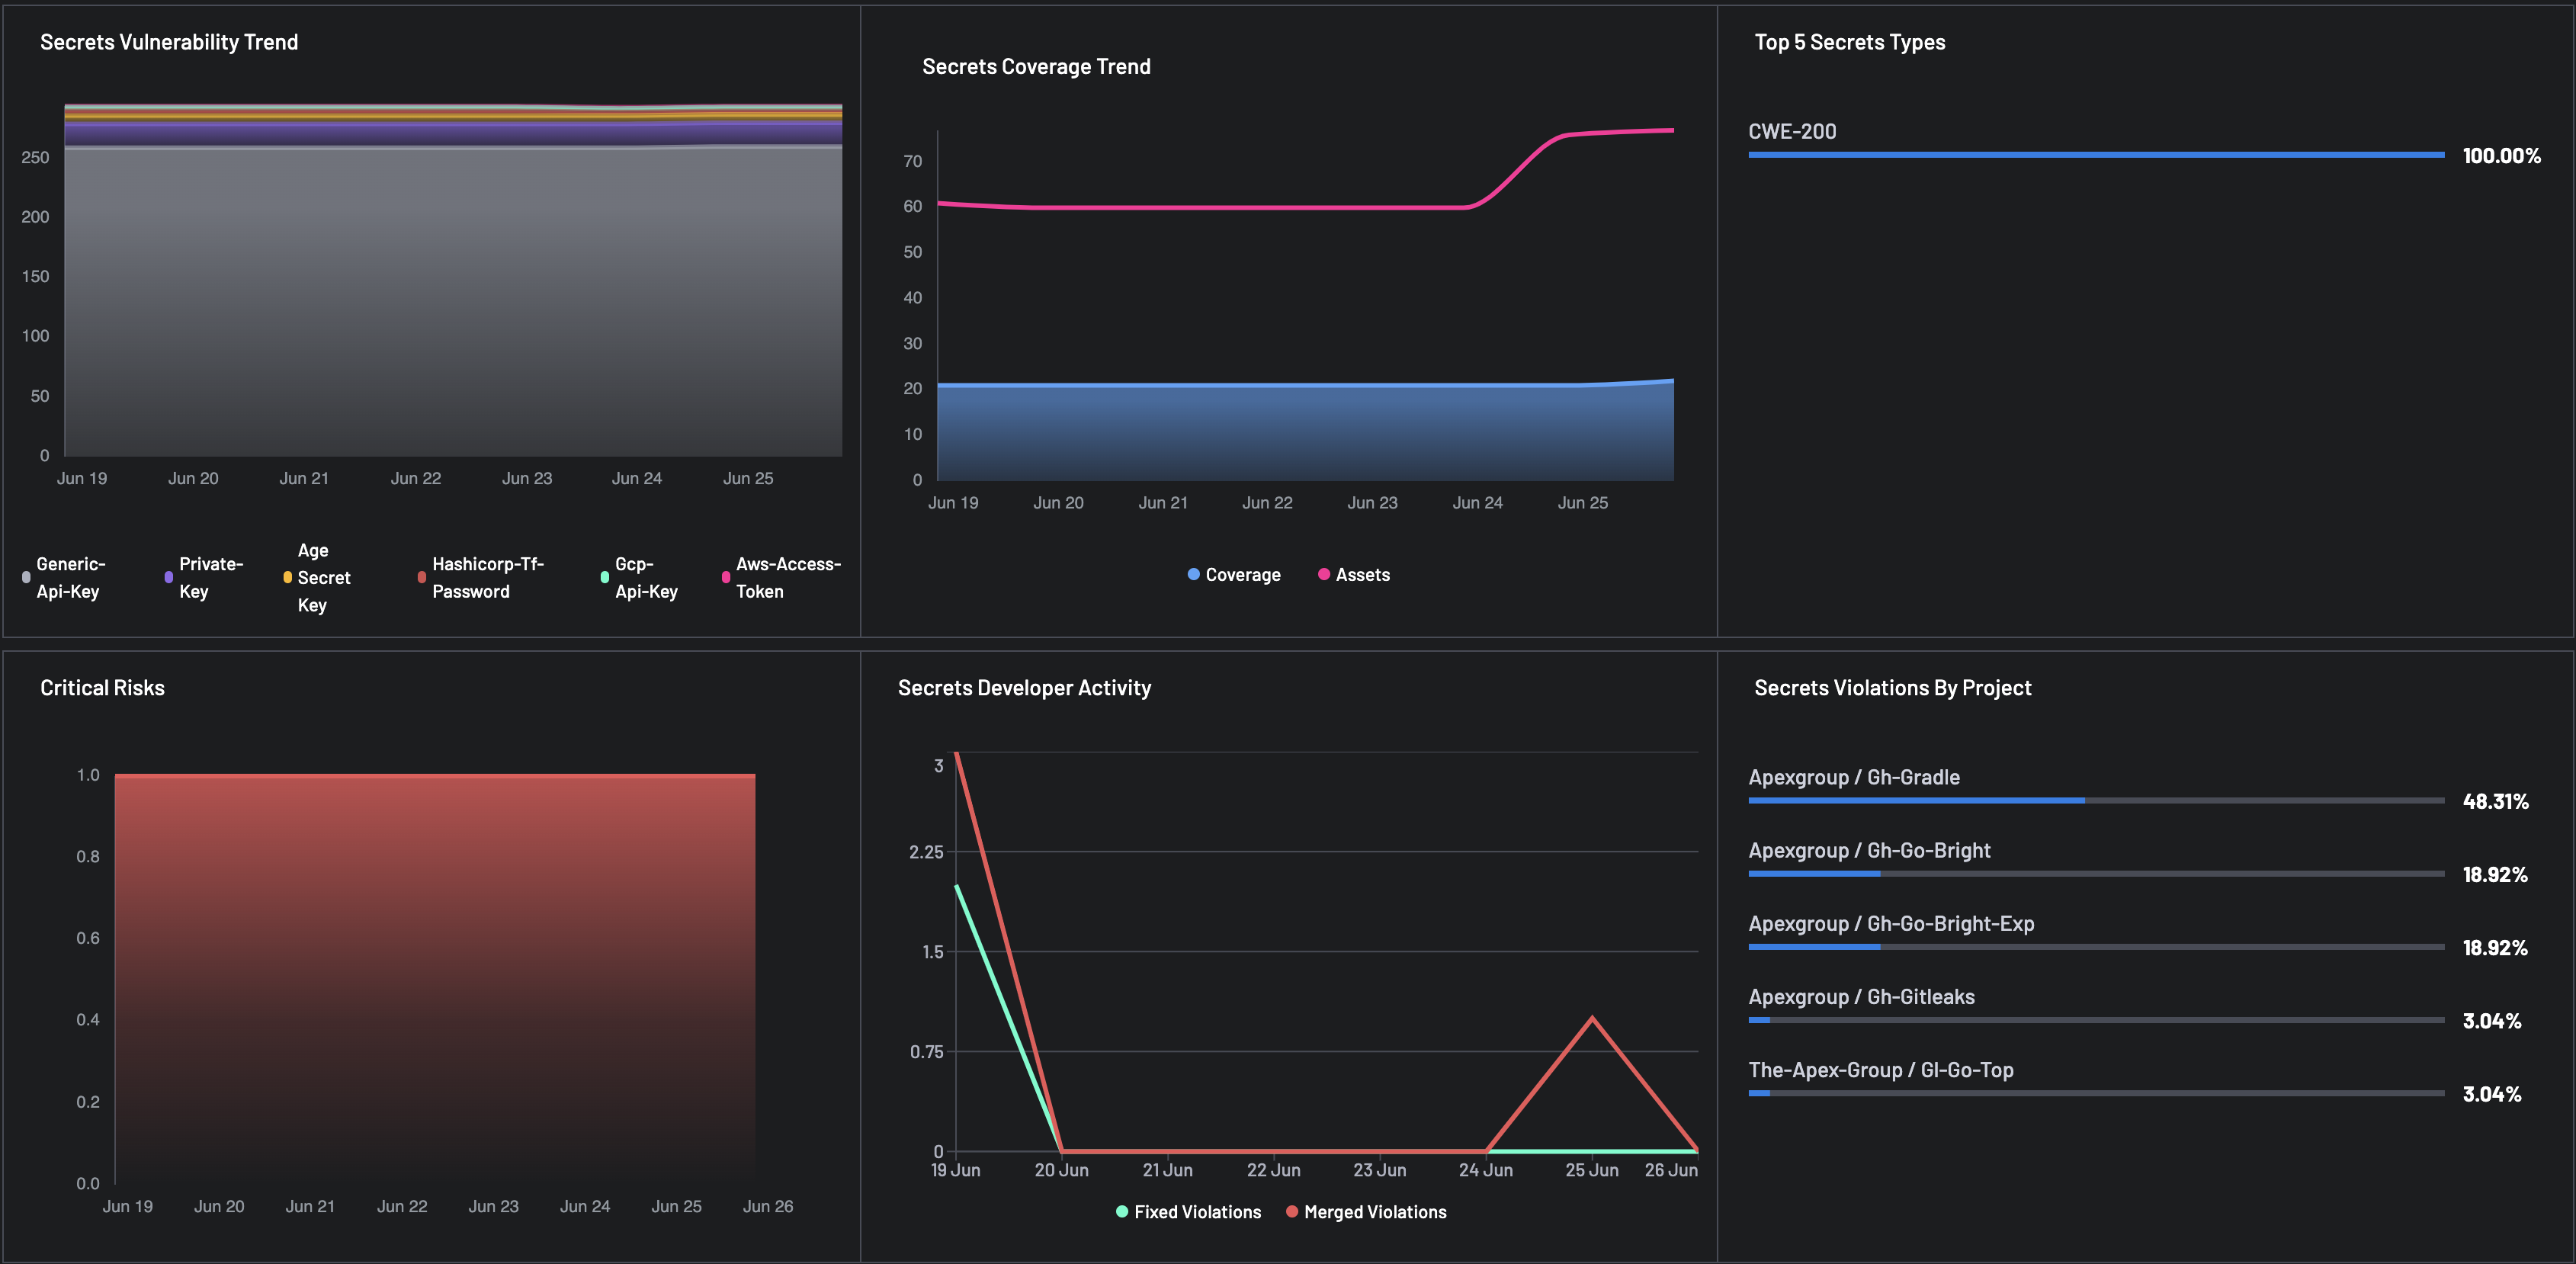
For each Finding Type selected, i.e.,: SAST, SCA, and Secrets, the report populated changes and gives you details for the following metrics:
-
Vulnerability Trend: Stacked bar chart representing severity distribution:
- Critical
- Warning
- Minor
- Not Set
-
Coverage Trend: Tracks scanning coverage versus total assets over time to reveal any visibility gaps.
- Top 5 Types: Lists the most common issue types flagged by the finding type tools.
- Critical Risks: Bar chart representing the time series for critical risks discovered.
- Violations by Project: Highlights which projects have the highest number of finding-type related violations.
- Developer Activity: Monitors developer engagement, e.g., number of merges and remediations, to gauge responsiveness and secure coding practices.